Figure 2.

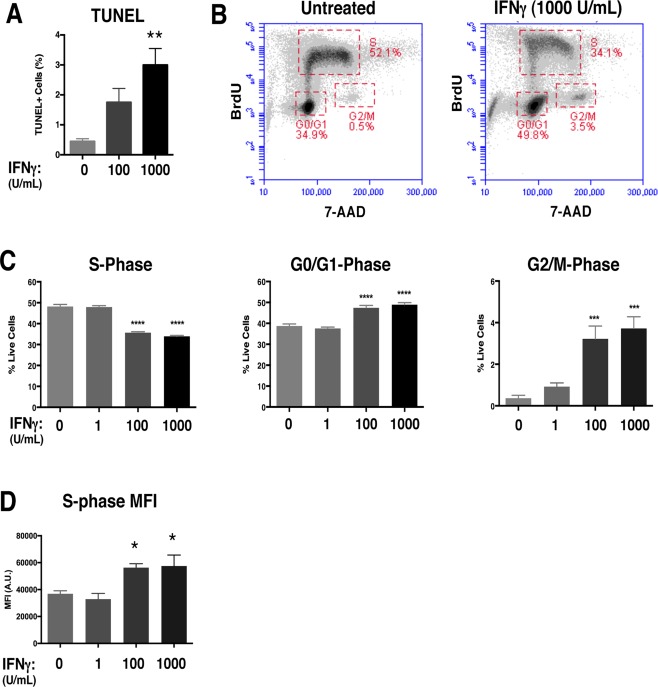
IFNγ restricts cell cycle progression in NSPCs and induces minimal apoptosis.
A: The TUNEL assay was performed on untreated and IFNγ‐treated (100 and 1000 U/ml; 72h) NSPCs. The average percentage of total TUNEL + cells from 3 independent experiments is plotted with SEM (one‐way ANOVA, ** p < 0.01). B: WT/NSPCs were treated with IFNγ (1, 100, 1000 U/ml) for 72h and labeled with BrdU and 7‐AAD. The intensity of BrdU and 7‐AAD staining per cell was assayed by flow cytometry. Cell populations were gated in different phases of cell cycle (S = synthesis phase, G1 = gap phase 1, M = mitosis phase, G2 = gap phase 2). Representative plots for untreated and IFNγ‐treated NSPCs (1000 U/ml) are shown. C: Quantitation of NSPCs in each cell cycle phase. The average percentage of cells in each cell cycle was plotted with SEM (n = 3). Statistical analysis was applied using one‐way ANOVA (****p < 0.0001; ***p < 0.001). D: Cells in the S‐phase gates were analyzed for mean fluorescence intensity (MFI, arbitrary units, A.U.) of the BrdU signal for all treatment groups. The MFI for the BrdU signal of IFNγ‐treated cells was compared with untreated controls using a one‐way ANOVA (*p < 0.05). [Color figure can be viewed at wileyonlinelibrary.com]
