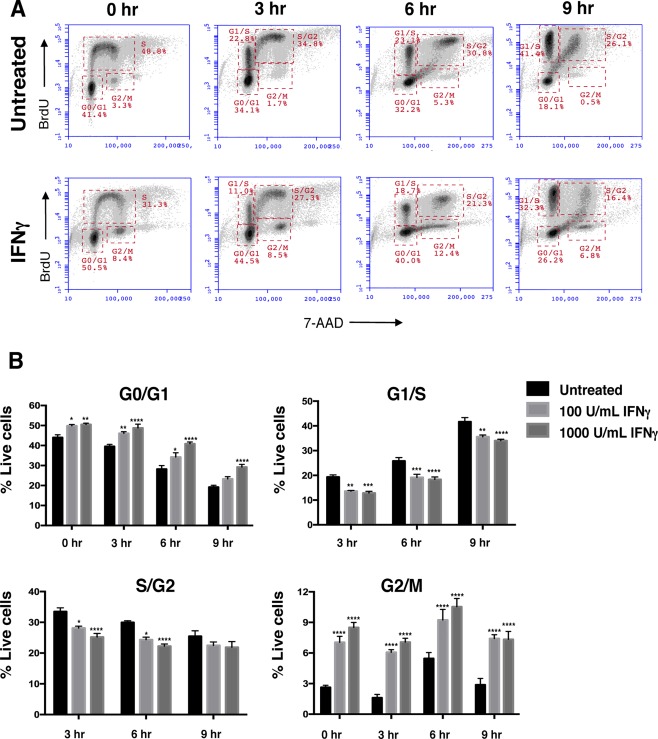
Figure 3.

IFNg decreases NSPC cell cycle progression.
WT NSPCs were treated with IFNg (100 U/ml) 3 days or left untreated. On day 3, the cells were pulsed with BrdU for one hour. The BrdU was washed out and the cells were harvested at 0, 3, 6, and 9h post‐washout. Cells were processed as described in materials and methods for BrdU/7‐AAD staining. A: Representative plots for untreated (top row) and IFNg‐treated (1000 U/mL, bottom row) NSPCs with gates for G0/G1, G1/S, S/G2, and G2/M phases at different time points. B: Averages of cell percentages in the each of cell cycle gate were quantified for untreated, and IFNg‐treated (100 and 1000 U/mL) NSPCs. Error bars represent SEM. Statistical analysis was applied using two‐way ANOVA with Bonferroni post‐hoc analysis (n = 3), *p < 0.05, **p < 0.01, ***p < 0.001, ****p < 0.0001. [Color figure can be viewed at wileyonlinelibrary.com]
