Figure 6.

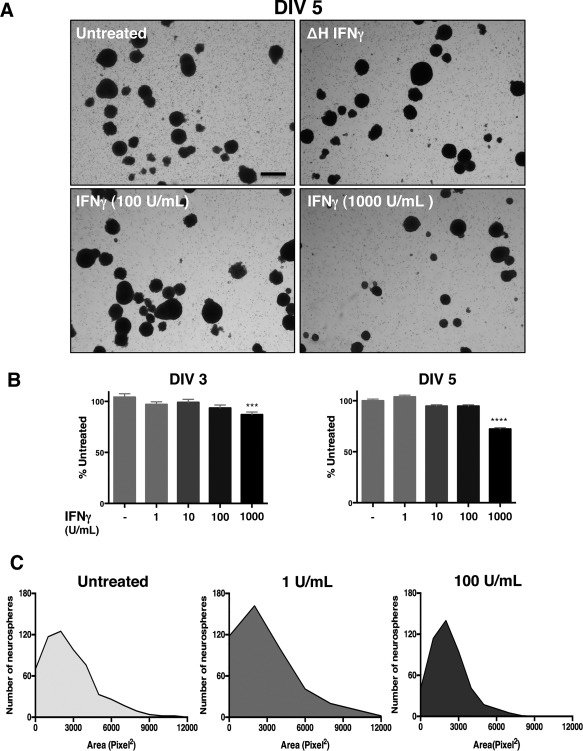
STAT1 is required for IFNγ‐mediated inhibition of neurosphere growth.
STAT1‐KO NSPCs were treated with IFNγ (1–1000 U/ml) or with heat‐inactivated IFNγ (ΔH IFNγ; 1000 U/ml) as a negative control for DIV 3 and 5 post‐IFNγ treatment A: Representative images of neurospheres imaged 5 days post‐IFNγ treatment at 2x magnification for different concentrations of IFNγ (Scale bar = 250 μm). B: Quantitation of neurosphere diameter at 3 and 5 days post‐IFNγ treatment. The longest diameter of each neurosphere was measured using Image J software. Data was collected from neurospheres in five fields/condition from three biological replicates and graphed as a percentage of untreated controls. Statistical analysis was applied by one‐way ANOVA (***p < 0.001, ****p < 0.0001). C: Histogram plots of neurosphere area for different concentrations IFNγ on DIV 5 as measured by pixel2 for each neurosphere. Frequency distribution of the number of neurospheres corresponding to the indicated neurosphere area in pixel2 was plotted for each condition. Note that the range of the x‐axis is greater than in Figure 1C.
