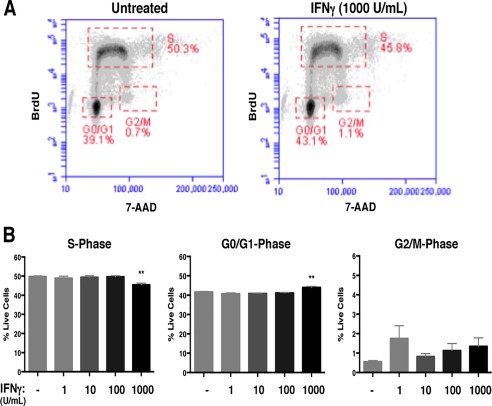
Figure 7.

IFNγ‐mediated regulation of cell cycle progression is STAT1‐dependent in NSPCs.
A: STAT1‐KO NSPCs were treated with IFNγ (1, 100, 1000 U/ml) for 72h and labeled with BrdU and 7‐AAD. The BrdU and 7‐AAD intensities per cell were assayed by flow cytometry. Cell populations were gated in different phases of cell cycle (S = synthesis phase, G1 = gap phase 1, M = mitosis phase, G2 = gap phase 2). Representative plots for untreated and IFNγ‐treated NSPCs (1000 U/ml) are shown. B: Quantitation of NSPCs in each cell cycle phase. The average percentage of cells in each cell cycle phase was plotted with SEM (n = 3). Statistical analysis was applied using one‐way ANOVA (**p < 0.01). [Color figure can be viewed at wileyonlinelibrary.com]
