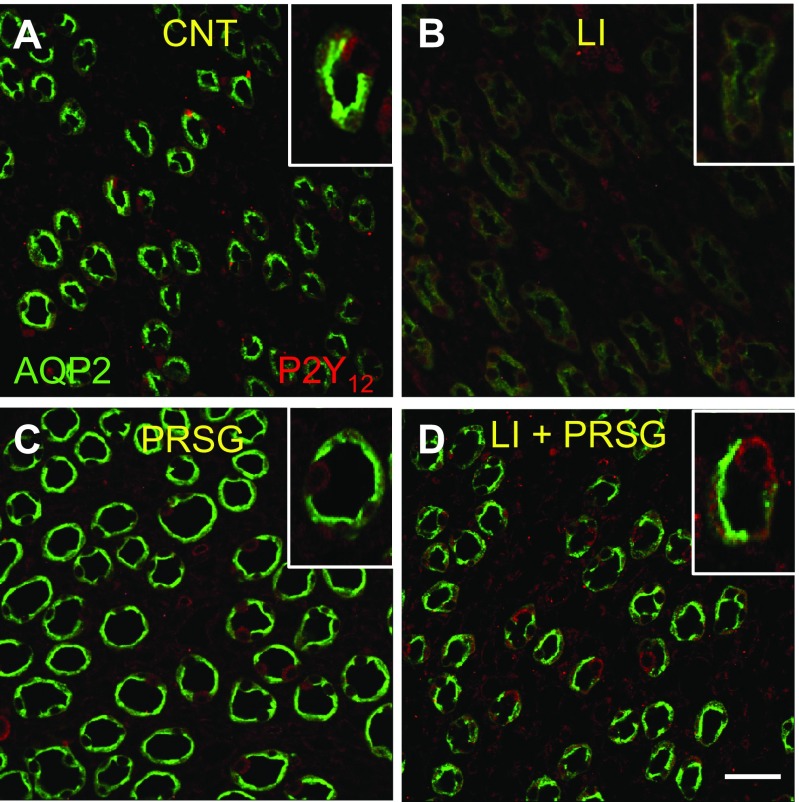
Fig. 4.
Immunofluorescence (IF) imaging of cellular expression and disposition of APQ2 (green) and P2Y12 receptor (red) proteins in the inner medullary collecting ducts of mice treated with PRSG and/or lithium in comparison with control mice. Representative low magnification profiles show IF labeling in mice treated with no drug (a), LI (b), prasugrel (PRSG) (c), or a combination of LI and PRSG (d). Insets show corresponding higher magnification profiles. Fluorescence imaging settings were the same in all groups. Bar is 20 μm

