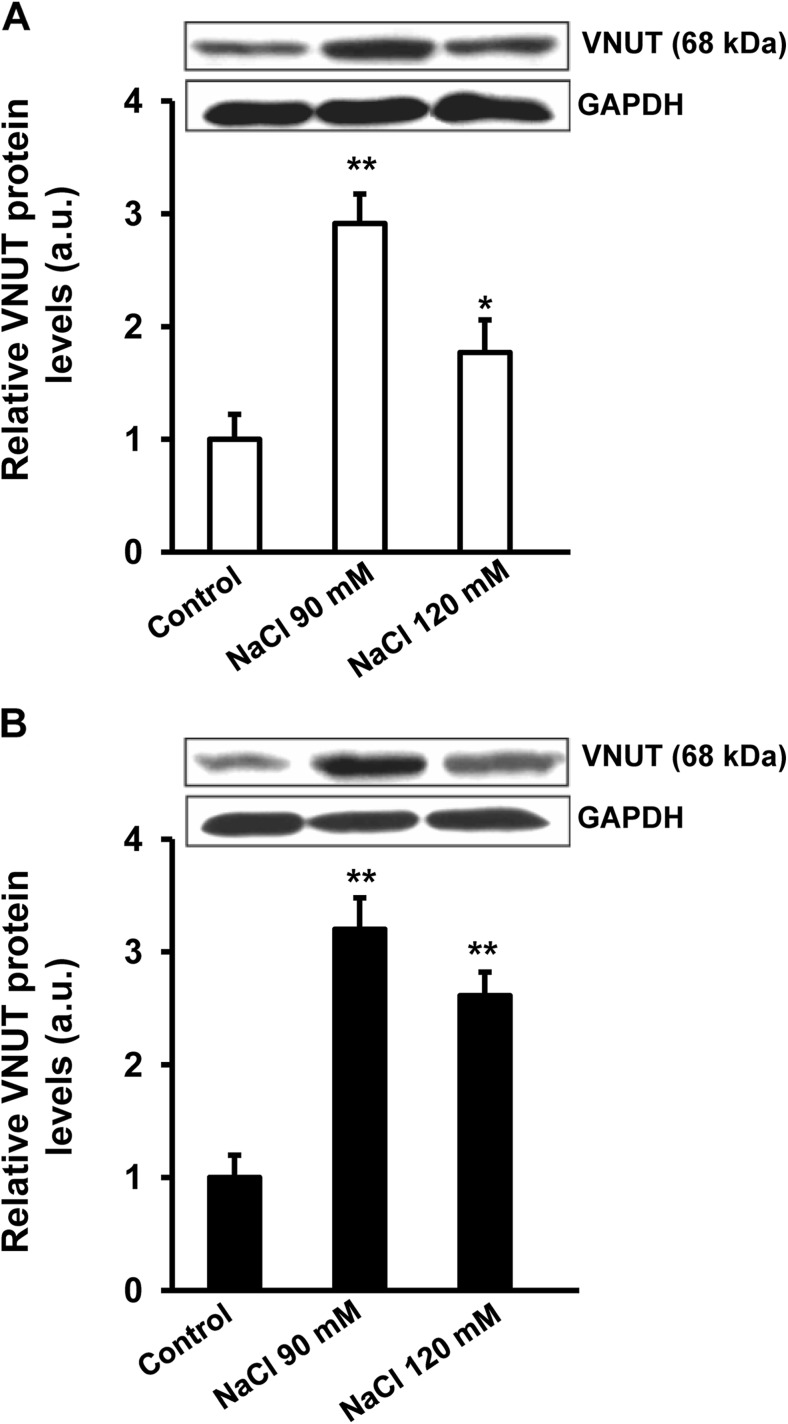
Fig. 3.
VNUT expression in control cells and cells exposed to hypertonic treatment. Stratified human corneal epithelial cells (a) and stratified human conjunctival epithelial cells (b) were exposed to 90 and 120 mM NaCl-added media for 24 h. Cell lysates were successively immunoblotted with anti-VNUT and anti-GAPDH receptor to verify equal loading. The histograms represent the levels VNUT. Data (mean ± standard deviation; n = 3) are represented in arbitrary units (a.u.) and normalized to the intensity of the band corresponding to control cells. * p < 0.05, ** p < 0.01 vs control

