
Figure 10.
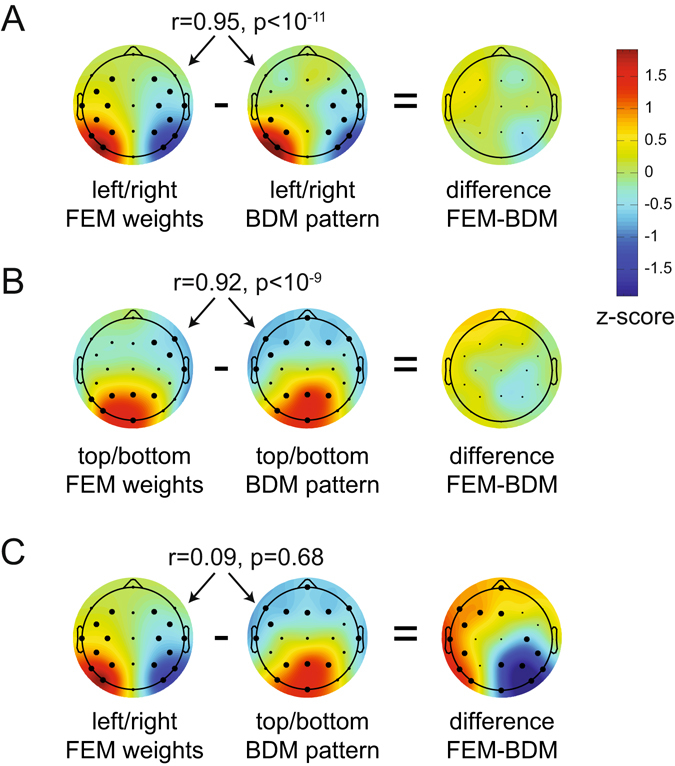
Comparing reconstructed weights in Experiment 2 to actual patterns in Experiment 1. The pearson correlation across population-averaged electrodes between FEM (Forward Encoding Model) weights from experiment 2 and BDM (Backward Decoding Model) patterns from experiment 1, as well as the unpaired t-test difference between FEM and BDM. (A) FEM and BDM left-right patterns show a high correlation and no significant differences. (B) FEM and BDM top-bottom patterns show a high correlation and no significant differences. (C) To show that the absence of significant differences in (A) and (B) is not caused by a lack of power due to t-testing between rather than within subjects, we also compare left-right FEM weights to the top-bottom BDM weights. These do not correlate, while their difference shows two large significant clusters. Thick electrode dots belong to clusters that have p < 0.01 under cluster based permutation testing.