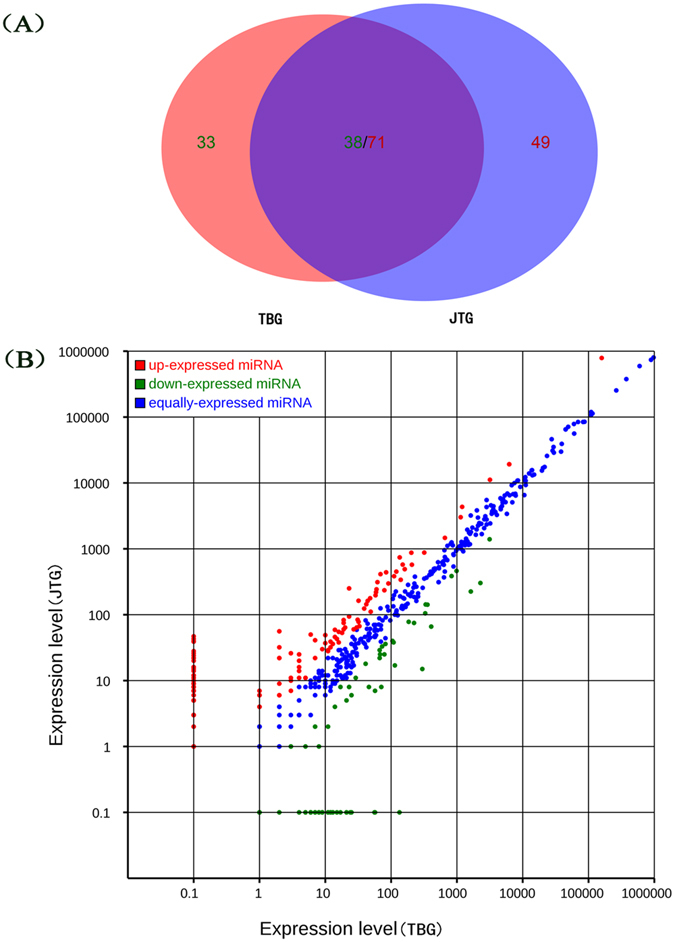
Figure 3.

Differentially expressed miRNAs between the non-prolific Tibetan goat (TBG) and prolific Jintang black goat (JTG) ovary libraries. (A) Venn diagram displaying the distribution of 191 differentially expressed unique miRNAs (fold-change ≥ 1.0 or ≤ −1.0 and q-value < 0.05) in the non-prolific TBG (left circle) and prolific JTG libraries (right circle). The overlapping region indicates co-expressed unique miRNAs. (B) In the scatter plot of differentially expressed miRNAs, the red points indicate miRNAs with ratios > 2; the blue points indicate miRNAs with 1/2 < ratios ≤ 2; and the green points indicate miRNAs with ratios ≤ 1/2. Ratio = normalized expression of JTGs/normalized expression of TBGs.
