
Figure 1.
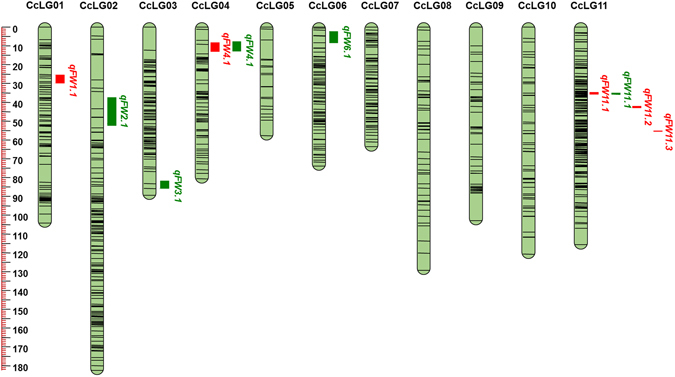
SNPs- based genetic map and distribution of QTLs associated with FW resistance for PRIL_A (ICPB 2049 × ICPL 99050) population. The scale is on the left indicating genetic distance (centi Morgan; cM as unit). The black lines in the linkage groups represent the genetic position of the markers. A total of six linkage groups, namely CcLG01, CcLG02, CcLG03, CcLG04, CcLG06 and CcLG11 possess eight QTLs for FW resistance. QTLs for FW resistance identified at Patancheru and Gulbarga locations were represented as a vertical bar in green and red colors, respectively.