
Figure 2.
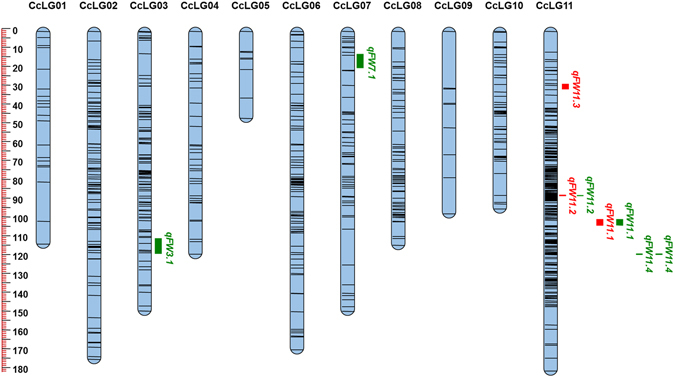
SNPs- based genetic map and distribution of QTLs associated with FW resistance in PRIL_B (ICPL 20096 × ICPL 332). The scale is on the left indicating genetic distance (centi Morgan; cM as unit). The black lines in the linkage groups represent the genetic position of the markers. A total of three linkage groups, namely CcLG03, CcLG07, and CcLG11 possess six QTLs for FW resistance. QTLs for FW resistance identified at Patancheru and Gulbarga locations were represented as a vertical bar in green and red colors, respectively.