
Figure 3.
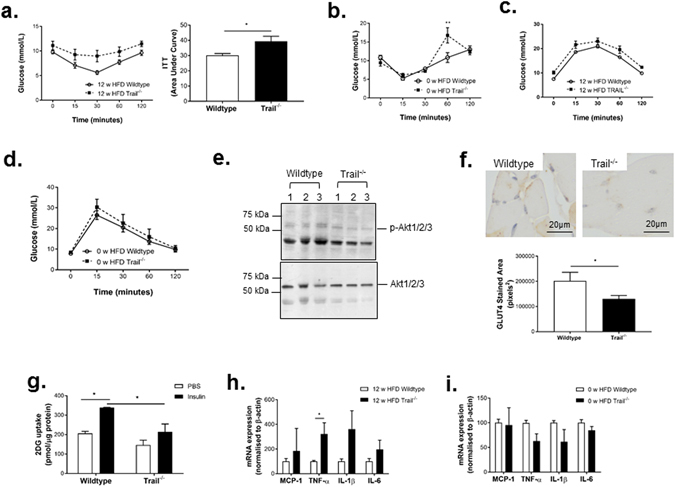
Trail −/− mice have impaired insulin sensitivity. (a) Insulin tolerance tests (ITT) in 12 w HFD mice (left panel); expressed as area under the curve (right panel; n = 10/genotype) or, (b) ITT at baseline (0 w HFD wildtype and Trail −/− mice; n = 3/genotype). (c) Glucose tolerance tests in 12 w HFD mice (left panel; n = 10/genotype) or, (d) at baseline (0 w HFD wildtype and Trail −/− mice; n = 3/genotype). (e) Western blotting showing that muscle from insulin-stimulated 12 w HFD Trail −/− mice have reduced p-Akt protein expression (3 independent mice/group). Total Akt protein expression is unaltered. (f) GLUT4 staining in muscle from insulin-stimulated (45 min) 0 w HFD Trail −/− and wildtype mice (n = 4/genotype) and (g) reduced glucose uptake ex vivo (n = 3–4/genotype). (h) Inflammatory marker expression is increased in muscle tissue of 12 w HFD Trail −/− vs. wildtype, but not at (i) baseline (n = 4–5/genotype). mRNA expression was normalized to β-actin. Results are expressed as mean ± SEM; ANOVA or Mann Whitney U test. *p < 0.05 and **p < 0.01.