
Figure 3.
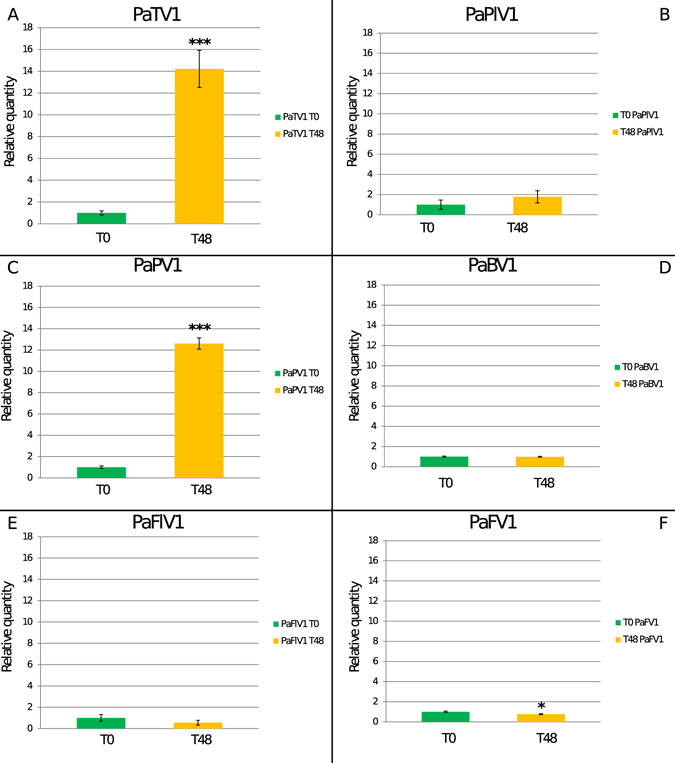
Absolute quantification of viral RNA in Nicotiana tabacum BY2 protoplasts at T0 and T48 time points. Quantitative Reverse transcriptase PCR (qRT-PCR) data were used. We present the data as a fold change of viral RNA at T48 compared to T0 to which we arbitrarily assigned the value 1. In panel A: absolute quantification of the Totivirus Penicillium aurantiogriseum totivirus 1 (PaTV1) quantification show ca. 14 times more RNA at T48 (yellow bar) than at T0 (green bar). In panels C: quantification of the Partitivirus Penicillium aurantiogriseum partitivirus 1 (PaPV1) show ca. 12 times more viral RNA at T48. Panels B,D,E and F show data for the other viruses: none of them displays a statistically significant increase in virus RNA load. *P < 0.05 **P < 0.01 and ***P < 0.001.