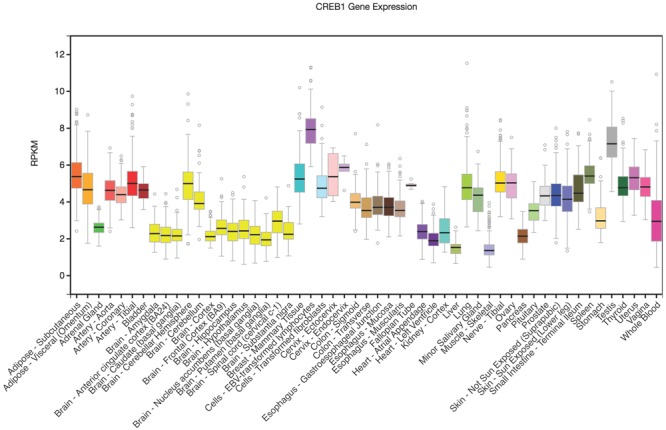
FIGURE 1.

CREB1 differential gene expression illustrated across tissues. Vertical axis is RPKM (reads per kilobase transcript per million) and horizontal axis shows the tissues. GTEx Browser (http://www.gtexportal.org/home/). The Genotype-Tissue Expression (GTEx) Project was supported by the Common Fund of the Office of the Director of the National Institutes of Health, and by NCI, NHGRI, NHLBI, NIDA, NIMH, and NINDS. The data used for the analyses described in this manuscript were obtained from: the GTEx Portal on 04/07/17.
