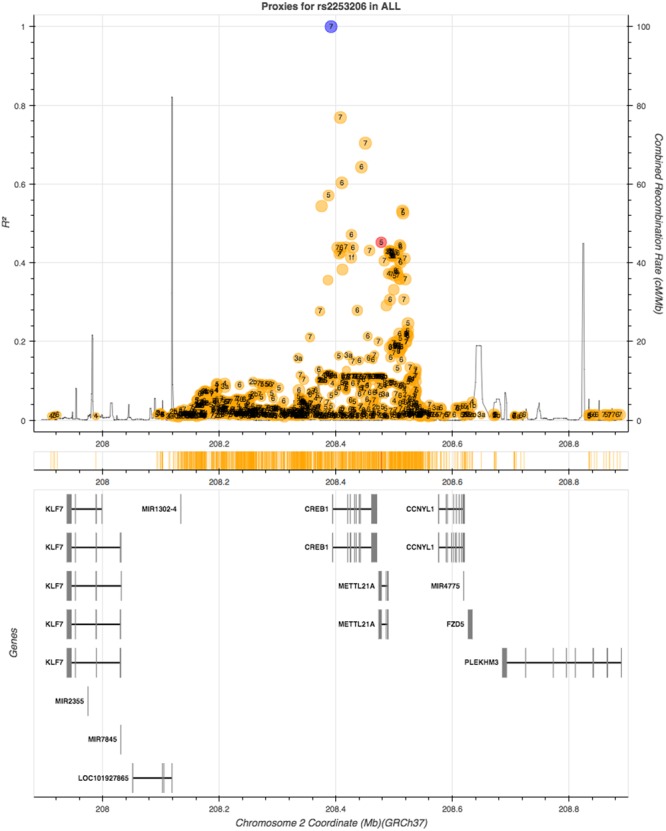
FIGURE 2.

Linkage disequilibrium (LD) proxy plot (generated using LDlink) for CREB1 gene rs2253206 polymorphism. Vertical axis is the LD (r2) measure and the horizontal axis is the chromosomal position with corresponding genes illustrated below. The blue dot represents rs2253206, yellow and red dots represent non-coding and coding region variants, respectively, and each variant has calculated for regulatory potential (1 being high and 7 being low).
