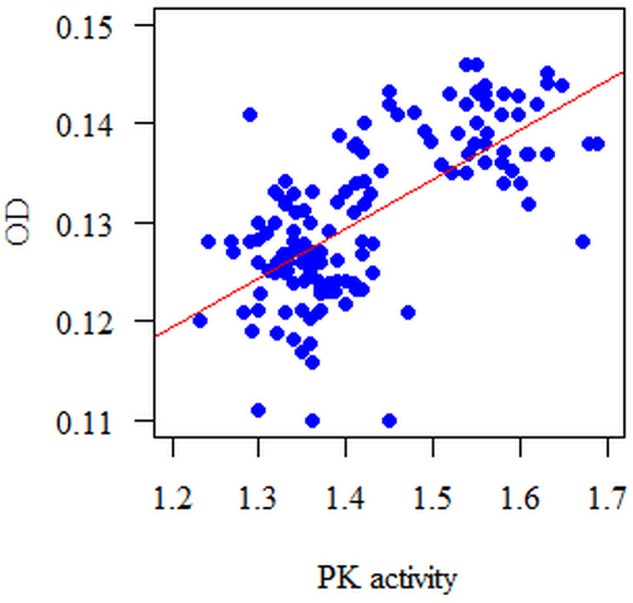
FIGURE 6.

Diagram of the biofilm biomass (OD = 540 nm) with respect to PK activity in the 18 h single-species biofilm. The analyzed features had no normal distribution (p < 0.05, Shapiro–Wilk test); therefore, the Spearman correlation coefficient was used for the analysis. The correlation between the PK and the biomass of the formed biofilm (OD) is statistically significant at each time point (p < 0.05). These dependencies are positive, i.e., the higher the PK activity, the bigger the biomass measured at a wavelength λmax = 540 nm (OD) and vice versa.
