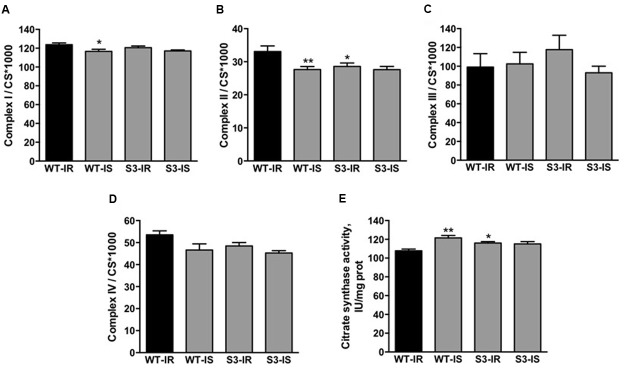
FIGURE 4.
Activity of ETC complexes I–IV (A–D) and citrate synthase (E) in cardiac mitochondria of WT and SIRT3-/- mice. Enzymatic activity of ETC complexes was measured spectrophotometrically using a specific substrate for each complex (see Materials and Methods). The activity of complexes was normalized to citrate synthase (CS) whereas CS activity was normalized to mg of mitochondrial protein. Groups are the same shown in Figure 1. ∗P < 0.05, ∗∗P < 0.01 vs. WT-IR. n = 5–7 per group.

