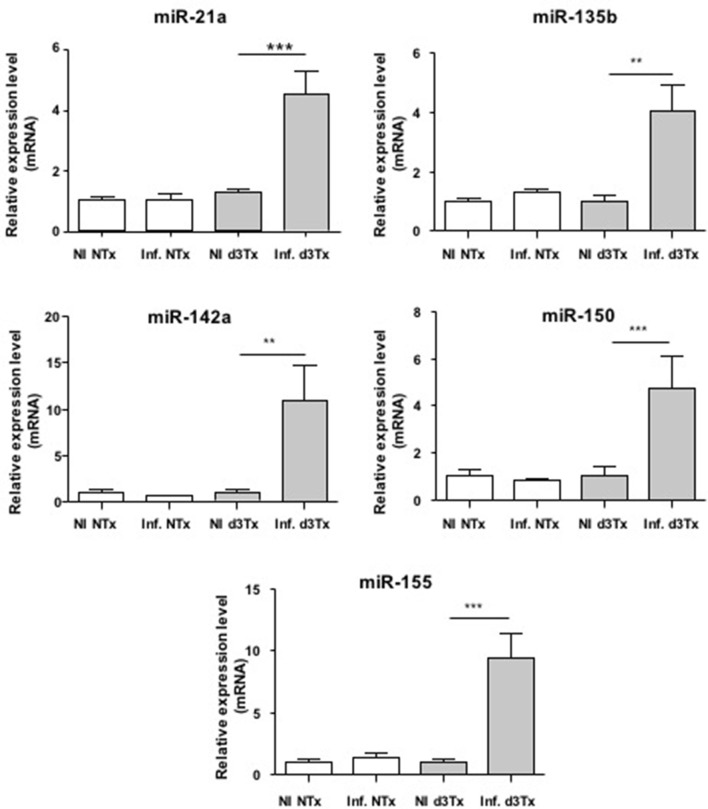
Figure 1.
Relative expression levels of miR-21a, miR-135b, miR-142a, miR150, and miR-155 in Helicobacter pylori infected and non-infected (NI) NTx and d3Tx mice stomachs. Expression levels quantified by RT-qPCR for infected NTx (n = 19) and d3Tx (n = 19) mice groups were normalized in comparison to expression levels for NI NTx (n = 7) and NI d3Tx (n = 7) control groups, respectively. SNORD72 was used to normalize miRNA expression levels. The results were similar to those obtained with RNU6. Data are plotted as bar graphs displaying the mean ± standard deviation for each group, **p < 0.01, ***p < 0.001.

