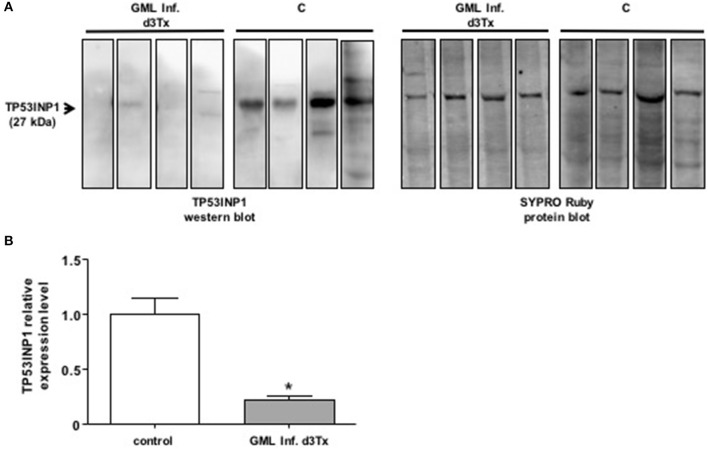
Figure 2.
Western blot analysis of TP3INP1 (A) Example of Western-blot analysis of TP3INP1 in four GML-developing, Helicobacter pylori infected d3Tx mice compared to four infected d3Tx mice showing no gastric inflammation. Corresponding Sypro Ruby staining are shown on the side. Weak of no visible TP53INP1 was found in GML-developing mice compare to control. (B) Quantification of Western-blot analysis of TP3INP1 in GML-developing, Helicobacter pylori infected d3Tx mice (n = 4) compared to infected d3Tx mice (n = 4) showing no inflammation (inflammatory scores = 0) or lymphoid infiltration (lymphoid infiltration = 0). Intensity of Sypro Ruby staining (total protein staining) was used for normalization. The production of TP53INP1 decreased in GML-developing mice compared to that observed in control mice. Data are plotted as bar graphs displaying the mean ± standard deviation for each group, *p < 0.05.

