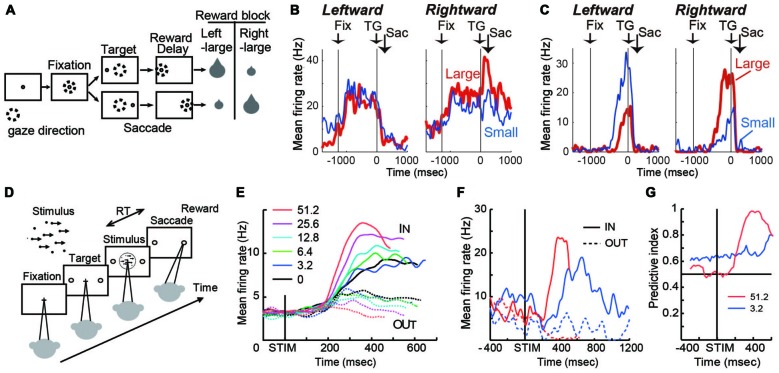
Figure 1.
(A) Visually guided saccade task with an asymmetric reward schedule. After fixating on the central fixation point (FP), a target cue appeared immediately on either the left or right, to which the monkey made a saccade to receive a liquid reward. The dotted circles indicate the direction of gaze. In a block of 20–28 trials (e.g., left-large block), one target position (e.g., left) was associated with a large reward, and the other position (e.g., right) was associated with a small reward. The position-reward contingency was then reversed (e.g., right-large block). (B) An example dorsal caudate neuron showing a target-direction effect (right-target dominant) after target onset until reward delivery. This neuron also showed a reward-size effect (right-large-reward dominant). Spike density functions (top) and raster plots in the chronological order are aligned to target onset (left, TG on) and reward onset (right, RW on). Red: large-reward trials; blue: small-reward trials; green dots: FP onset; black dots: saccade onset; light blue dots: reward onset and offset. Dots for reward offset are only visible for large-reward trials. (C) An example dorsal caudate neuron showing a reward-direction effect. Note that this neuron showed stronger pre-target activity for the right-large block. (D) The motion discrimination task. The monkey decides the global motion direction of a random-dot kinematogram and then at a self-determined time, make a saccade to one of two choice targets. Saccades to the target in the direction of coherent motion are followed by juice reward. (E) Population average of evidence accumulation activity aligned on stimulus onset for correct trials (truncated at median reaction time (RT) after excluding activity 100 ms before saccade onset). Solid lines, trials to the neurons’ preferred direction (IN trials); dashed lines, trials away from preferred direction (OUT trials). Coherence levels are indicated by colors. (F) Activity of an example neuron before and during motion viewing. Blue, 3.2%; red, 51.2% motion coherence. Note that the activity before stimulus onset was different between trials with different final choices (solid vs. dashed lines) at 3.2% coherence, but it was not at 51.2% coherence. (G) Time course of the predictive index, which quantifies how well an ideal observer can predict the final choice based on neural activity. Before stimulus onset, it was significantly larger than chance (0.5) for low motion-strength trials (e.g., 3.2% coherence) and at chance for high motion-strength trials (e.g., 51.2% coherence); after stimulus onset, the pattern reversed, with the predictive index increasing sharply for high motion-strength trials.

