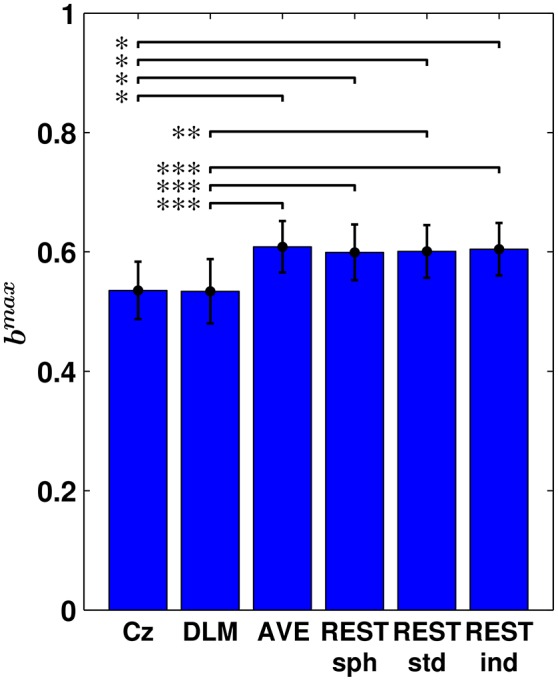
Figure 5.

Maximum bicoherence (bmax) obtained for the different EEG reference schemes. The bar plot shows the average bmax across subjects and its standard error. Statistical comparison between the different reference schemes was performed by using a paired sampled t-test (*p < 0.05; **p < 0.01; ***p < 0.001; two-tailed; fdr-corrected; permutation test).
