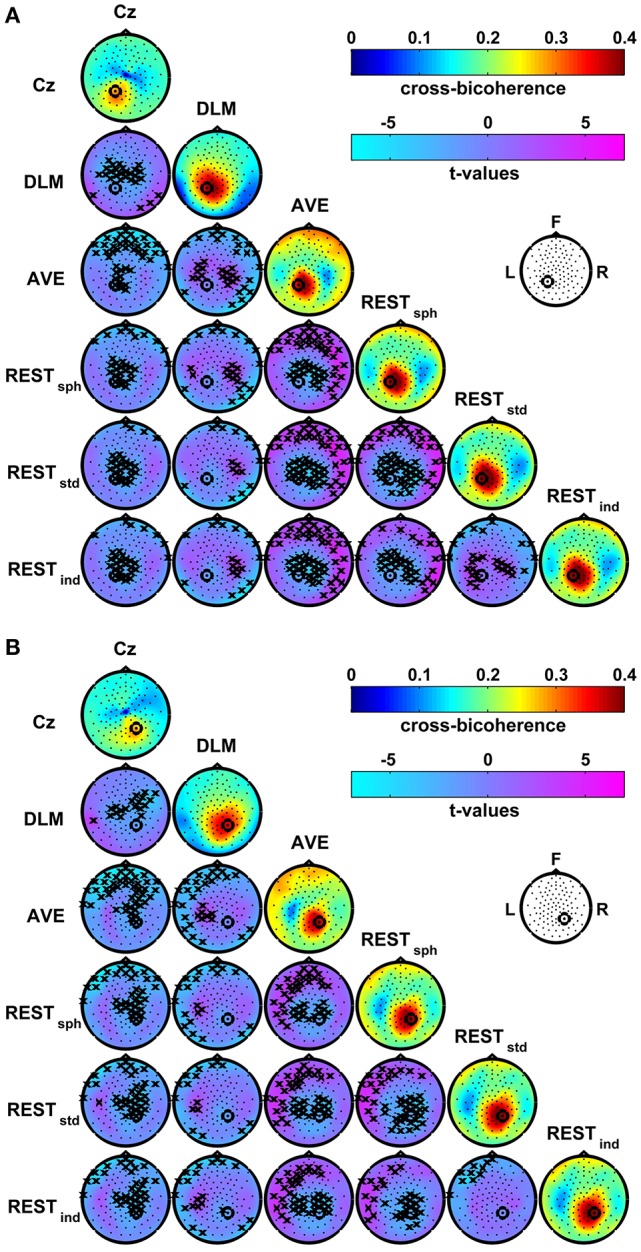
Figure 6.

Effects of the EEG reference choice on the estimation of alpha-beta connectivity using cross-bicoherence. Panel (A): maps of connectivity with seed channel P1. Panel (B): maps of connectivity with seed channel P2. The seed channels have been marked by a black circle. Main diagonals: maps of the average cross-bicoherence across subjects obtained for the different EEG reference schemes. Off-diagonals: maps of t-values for pairwise contrasts between cross-bicoherence maps from different EEG reference schemes using a paired-sample t-test; the black crosses mark the channels showing significant differences at the p < 0.05 level (two-tailed) based on a permutation test (10,000 randomizations).
