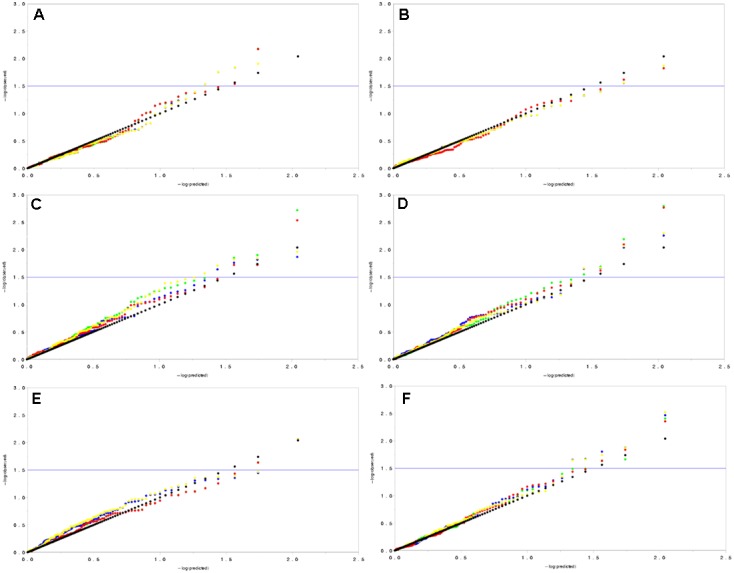
FIGURE 4.

Quantile–quantile plots for model comparison with physiological and photosynthetic traits under well water and drought treatment. In this figure, black dots represent the standard line means that the predicted value equal to the observed value; yellow dots represent the simple linear model (without population structure and relative kinship); green dots represents the Q model; blue dots represents the K model; and red dots represent the Q+K model. (A) Evaluation of model types using markers for LWC. (B) Evaluation of model types using markers for MDA. (C) Evaluation of model types using markers for Pn. (D) Evaluation of model types using markers for Gs. (E) Evaluation of model types using markers for Ci. (F) Evaluation of model types using markers for Tn.
