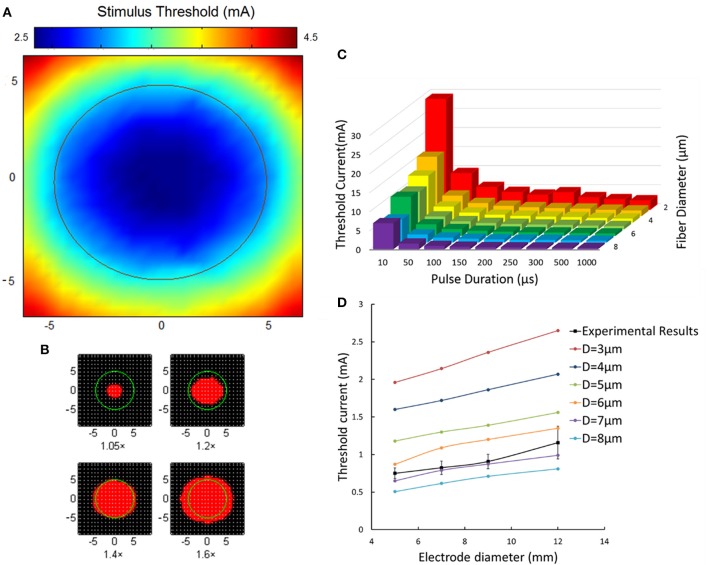
Figure 10.
Aβ tactile nerve fiber excitability under different electrical stimulation. (A) The nerve excitation threshold distribution under the TENS (Φ-9 mm electrode). The color map corresponds to the threshold distribution. The middle circle corresponds to the 9 mm stimulating electrode. (B) The nerve excitation area (red) varies with different stimulating current. The 1.05× means the stimulating current was 1.05 times the least threshold current in the skin. The same as 1.2×, 1.4×, and 1.6×. (C) The fiber excitation thresholds under different pulse duration with different-diameter fibers. (D) The threshold current for 3–8 μm diameter axons under different size of electrode stimulation. The dashed line corresponds to the experimental threshold current density. Error bars show the standard deviations of experimental results.

