
Figure 9.
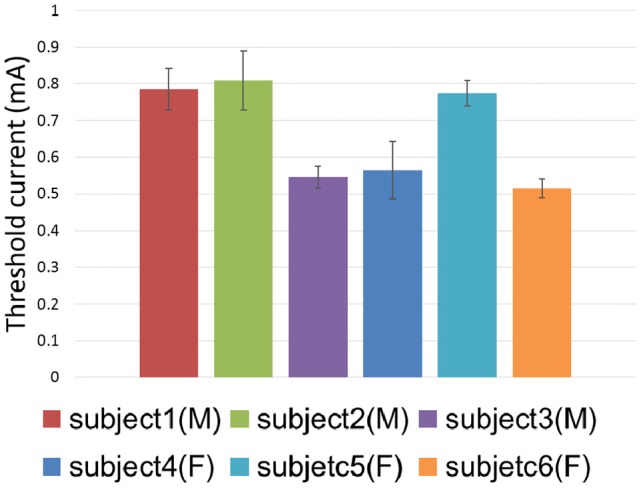
Threshold current distribution among different subjects. Error bars showed the standard deviations of psychophysical experimental results.
Official websites use .gov
A
.gov website belongs to an official
government organization in the United States.
Secure .gov websites use HTTPS
A lock (
) or https:// means you've safely
connected to the .gov website. Share sensitive
information only on official, secure websites.
Threshold current distribution among different subjects. Error bars showed the standard deviations of psychophysical experimental results.