FIGURE 2.

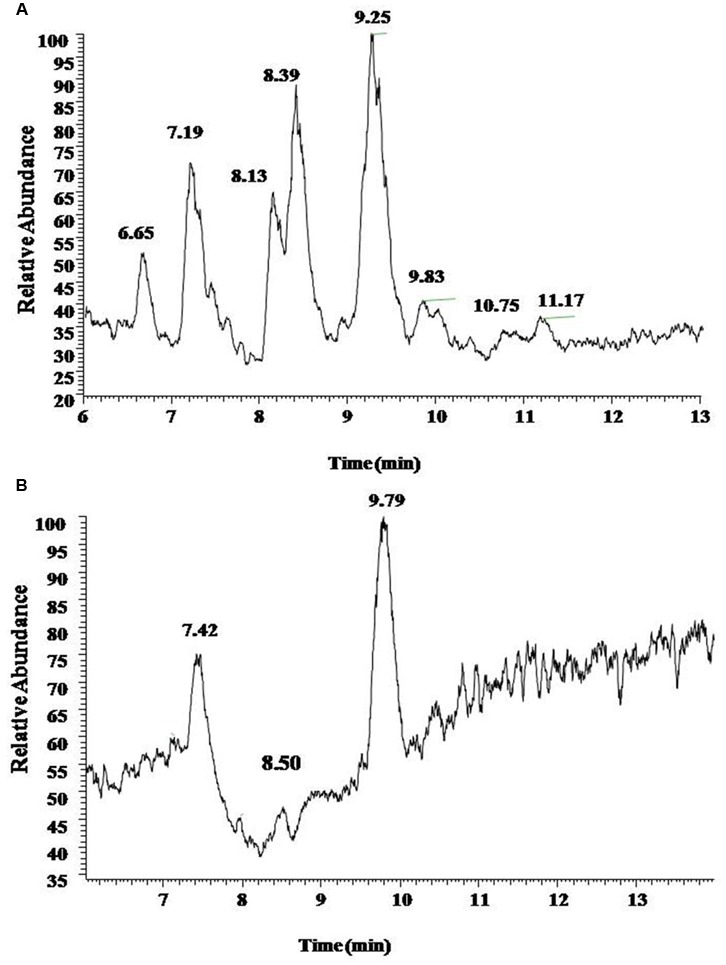
The UV chromatogram of reference standards (A) and sample (B). Both reference standards and sample displayed Peak A at retention time 7.5 min, Peaks B and C at 8.5 and 9.5 min.

The UV chromatogram of reference standards (A) and sample (B). Both reference standards and sample displayed Peak A at retention time 7.5 min, Peaks B and C at 8.5 and 9.5 min.