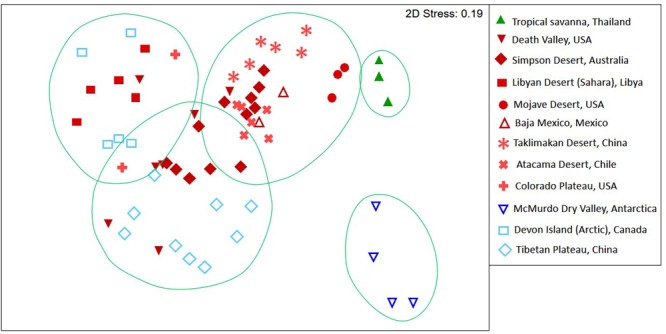
FIGURE 1.

Non-metric multidimensional scaling plot of Bray–Curtis similarities for t-RFLP defined bacterial communities recovered from hypoliths in major deserts worldwide. Circles indicate clusters of communities at a 40% dissimilarity threshold. Colors denote macroclimate (Peel and Finlayson, 2007): Polar frost (EF) = dark blue, Polar Tundra (ET) = light blue, Cold desert (BWk) = light red, Hot desert (BWh) = dark red, Tropical savanna (Af) = green.
