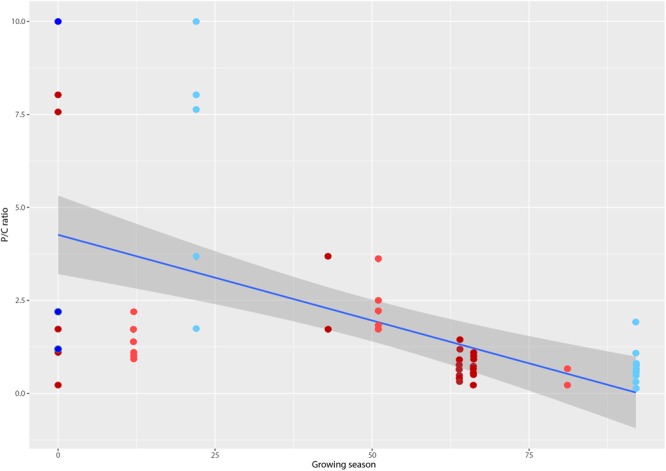
FIGURE 2.

Plot of producer/consumer ratio (P/C) for hypolithic communities versus growing season, a metric that defines the number of days per year when photosynthesis is possible (d) (Paulsen et al., 2014). Colors denote macroclimate according (Peel and Finlayson, 2007): Polar frost (EF) = dark blue, Polar Tundra (ET) = light blue, Cold desert (BWk) = light red, Hot desert (BWh) = dark red. Locations from left to right are: McMurdo Dry Valleys, Antarctica; Libyan Desert (Sahara), Libya; Taklimakan Desert, China; Devon Island (Arctic), Canada; Baja Mexico, Mexico; Atacama Desert, Chile; Simpson Desert, Australia; Mojave Desert, USA; Death Valley, USA; Colorado Plateau, USA; Tibetan Plateau, China. Line shows linear regression fit (R2 = 0.2908, p < 0.0001) and shaded area denotes 95% confidence limits.
