Figure 5.
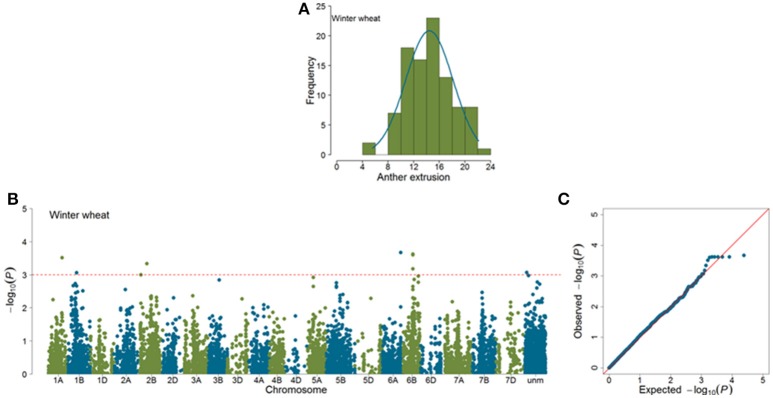
Summary of genome-wide association studies results for anther extrusion (AE) in winter wheat panel (WP). (A) Distribution of Best Linear Unbiased Estimates of AE (B) Manhattan plots based on mixed linear model using kinship matrix (K) to correct for population stratification. Horizontal dashed line corresponds to the threshold (|log10(P)| > 3.0) for MTA estimation. (C) Quantile-quantile plots depicting expected vs. observed |log10(P)| values.

