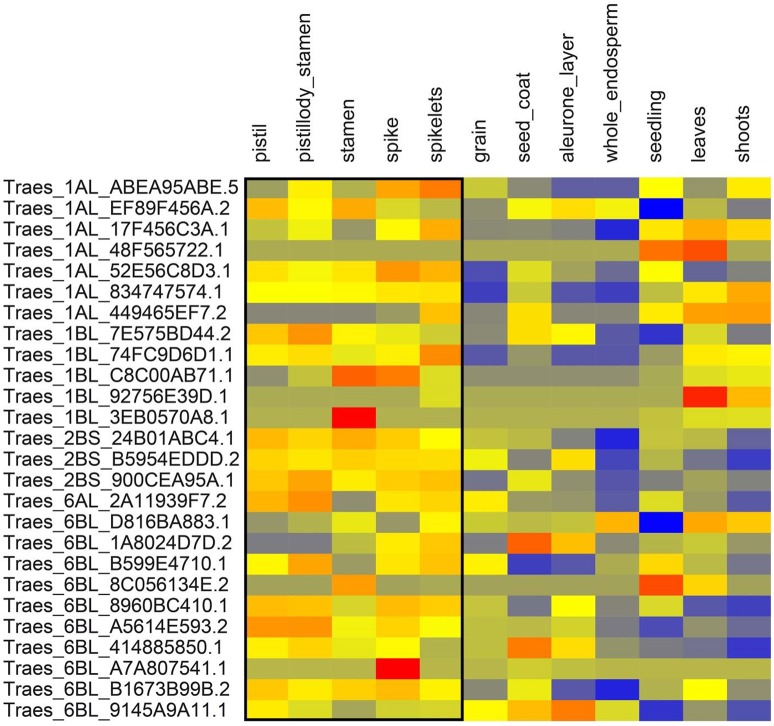
Figure 7.
Expression of genes from winter wheat panel in above ground tissues. Expression values are given at log2 scale of transcripts per million (tpm): red, high expression; yellow, moderate expression; blue, low expression. Each individual gene (transcript_ID) is represented as horizontal row and different tissues are described in vertical columns. Tissues from pistil to spikelets show higher expression values for most genes compared to other tissues. Gene expression data were obtained from http://www.wheat-expression.com.

