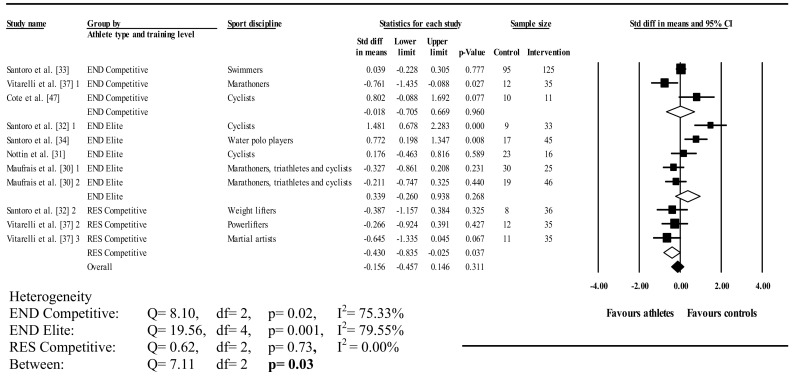
Fig. 8.

Forest plot showing meta-analysis of athlete–control differences in left ventricular peak untwisting velocity using traditional categorization and athlete training level. Closed square study effect size; size of symbol and confidence intervals represent study weight and precision, respectively, in the meta-analysis, closed diamond overall summary effect, open diamond overall summary effect within category, diamond width represents overall summary effect precision, CI confidence interval, END endurance, RES resistance, 1, 2, and 3 denote multiple athlete–control comparisons from the same study
