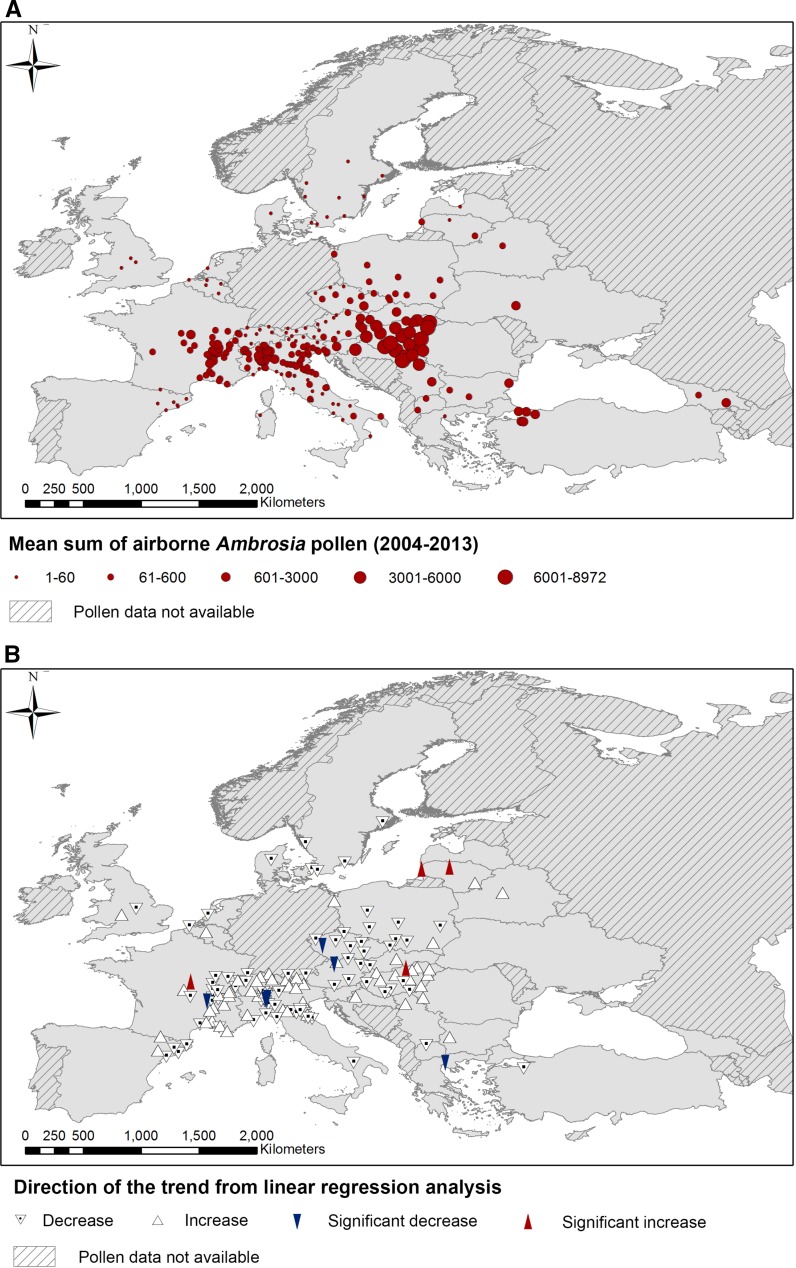
Fig. 1.
The location of pollen-monitoring sites involved in the study, showing the following results calculated using the mean sum of available daily airborne pollen concentrations from August to September during the years 2004–2013: a the mean sums of airborne Ambrosia pollen concentration; b significant trends and the direction of slope of linear regression analysis (only sites with ≥8 years of pollen data). Regions where pollen data were not available are also depicted

