Figure 1.
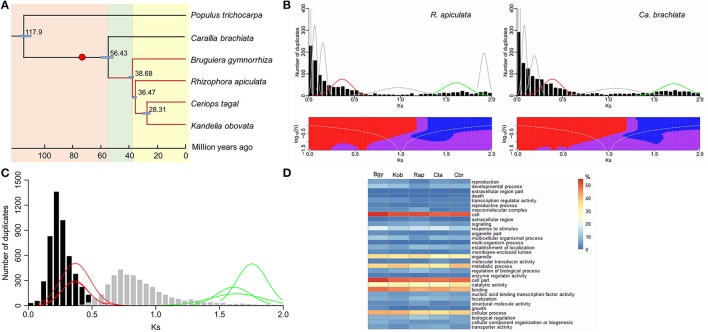
Divergence time and whole-genome duplication in Rhizophoraceae. (A) Phylogenetic relationships and divergence time of the five Rhizophoraceae species. (B) Histograms of gene duplication ages using the mixture model (above) and SiZer (below) analysis for the mangrove R. apiculata and terrestrial Ca. brachiata. (C) The relative placement of two inferred whole-genome duplications (WGDs) in Rhizophoraceae. (D) Gene Ontology (GO) annotations of paleologs from each Rhizophoraceae species examined. The red dot in the phylogenetic tree in (A) indicates the time when the inferred WGD shared by Rhizophoraceae occurred. Plots of normal distributions in (B) were fitted from mixture model analysis; red lines represent the younger WGDs shared in Rhizophoraceae, while green lines probably correspond to the older triplication shared by all angiosperms. Red and blue areas in SiZer maps indicate significantly decreasing and increasing slopes, respectively; purple represents no significant slope change; and gray indicates not enough data for the test. In (C), histograms represent KS distributions of ortholog genes between Ca. brachiata and B. gymnorrhiza (black), and between Ca. brachiata and P. trichocarpa (gray); red and green lines refer to (B). In (D), colors represent the percentage of paleologs that a particular GO category composes; Bgy, Kob, Rap, Cta, and Cbr represent B. gymnorrhiza, K. obovata, R. apiculata, Ce. tagal, and Ca. brachiata, respectively.

