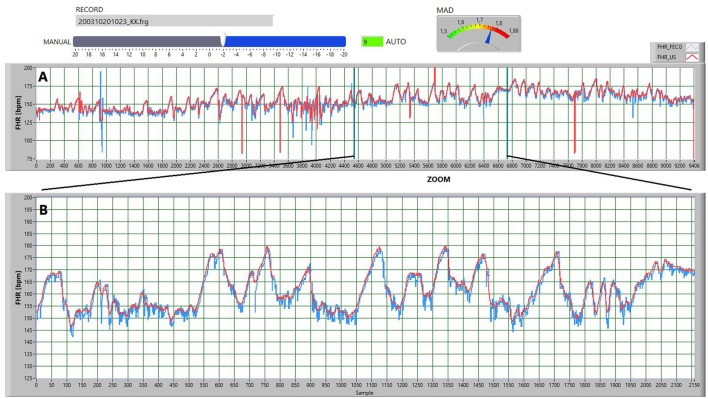
Figure 1.
The screen illustrating the operation of the procedure for synchronizing the two signals, determined via the ultrasound (red FHR_U) and electrocardiographic (blue FHR_E) methods. (A) Presents the concept of automated synchronization via minimizing the mean error. The current value of the mean absolute difference MAD parameter is displayed on the gauge. Auto mode had automatically set up the value of the shift parameter to 9 samples forward. However, basing on a visual analysis of the signals, that shift was manually corrected using a slider—the FHR_U signal was shifted by 2 samples backward in relation to the FHR_E signal. (B) Shows the enlarged signal fragment from part A, but after a procedure for removing the sudden FHR changes. It allows for additional manual synchronization and final validation of the recording for further investigations.

