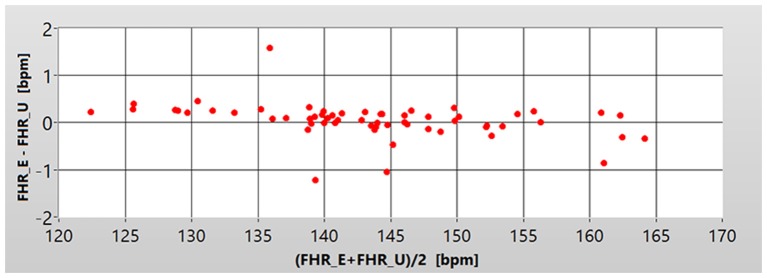
Figure 2.
Bland Altman plot showing the dependence of the mean value of the differences MD (Y axis) between corresponding instantaneous values of FHR_U and FHR_E, in relation to the average fetal heart rate in the recording (X axis), for each of the 60 pairs of signals. The values are expressed in beats per minute—bpm.

