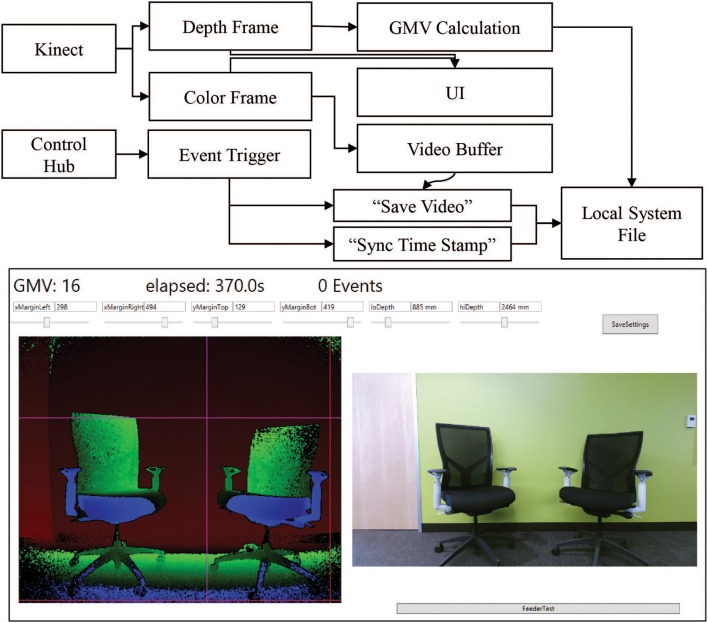
Figure 3.
Kinect software setup. Top. Information flow block diagram. Behavioral data is collected using a combination of the Kinect data streams and the control hub event triggers. The Kinect produces simultaneous color (bottom right) and depth value (bottom left) frames of the scene. Both frames are sent to the UI for visualization of the scene to set margin and depth cutoff values. The depth frame is also passed to the calculation module of the main program. The color frame is passed to a video buffering module which maintains a constant 8-s video. When the control hub sends an event trigger to the program, the video buffer is allowed to run 4 additional seconds before saving the video. The event trigger also triggers a time stamp value to sync the movement calculation. The calculations and the videos are saved to file in real time to prevent excess memory requirements. Bottom. The primary UI of the system displays key elements for setting up the behavior monitoring system. The current GMV value, elapsed time and event count are displayed in the top left corner. The depth (left) and color (right) streams are displayed in real time. Each margin and depth cutoff setting has its own slider for on-the-fly adjustments of the field of view for the GMV calculation. Clicking “SaveSettings” applies the settings at the start of the next session. The feeder test button sends a test pulse to the control hub to trigger the feeder and the “Save Video Test” button triggers the video saving functioning of the program.

