
FIGURE 3.
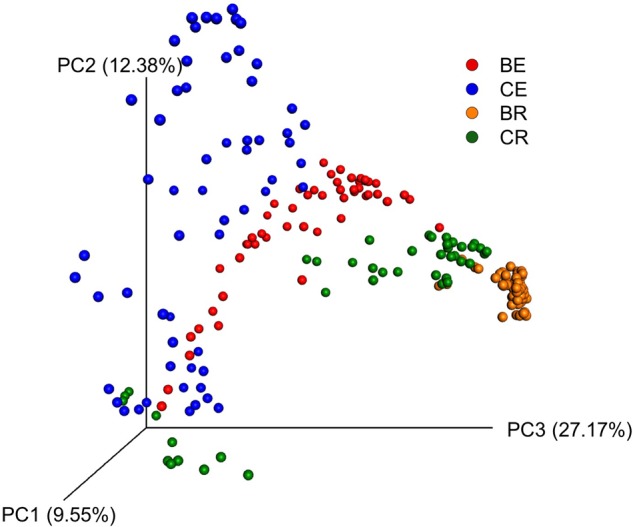
Principal coordinate analysis (PCoA) based on Bray–Curtis dissimilarity between samples for barley endosphere (BE), clover endosphere (CE), barley rhizosphere (BR), and clover rhizosphere (CR).
Official websites use .gov
A
.gov website belongs to an official
government organization in the United States.
Secure .gov websites use HTTPS
A lock (
) or https:// means you've safely
connected to the .gov website. Share sensitive
information only on official, secure websites.
Principal coordinate analysis (PCoA) based on Bray–Curtis dissimilarity between samples for barley endosphere (BE), clover endosphere (CE), barley rhizosphere (BR), and clover rhizosphere (CR).