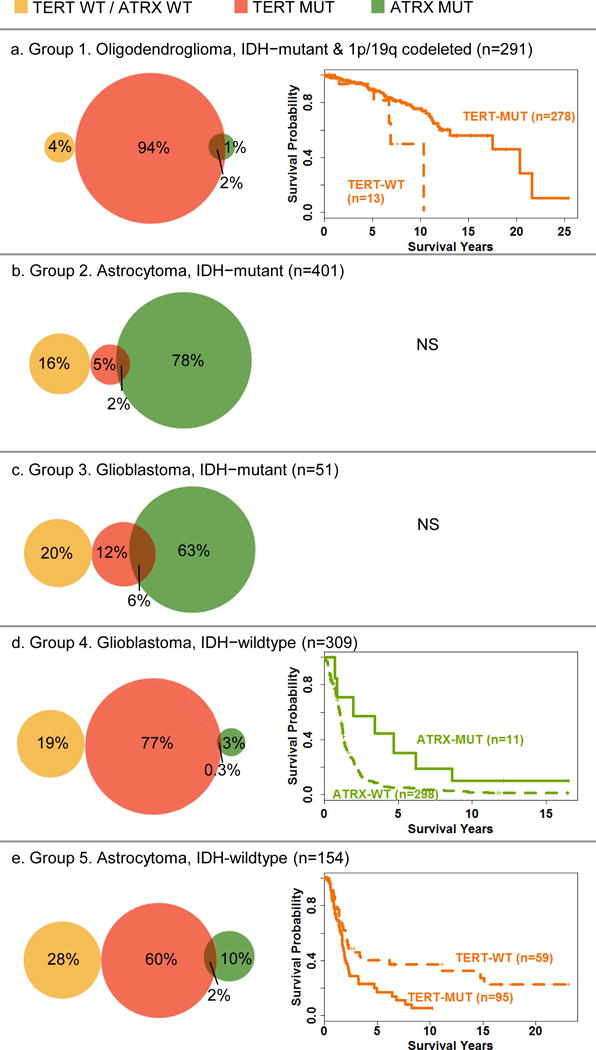
Fig. 2.

Venn diagrams showing the distribution of TERT/ATRX status by WHO 2016 groups and age (and grade when appropriate) adjusted Cox survival curves for WHO 2016 groups that have a statistically significant association of TERT or ATRX with survival in multivariate models. Vertical lines on survival curves indicated censored observations. NS=No statistically significant associations for survival were found for TERT or ATRX in multivariate models. Note that some percents add up to more than 100 due to rounding errors.
