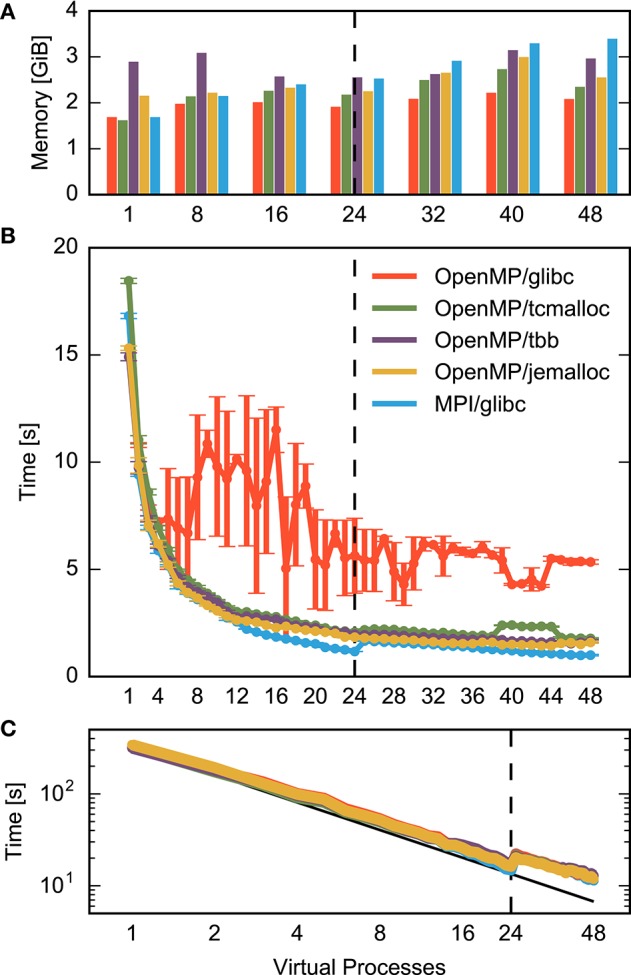
Figure 5.

Performance of a small neuronal network model using different memory allocators. (A) Memory consumption after network construction, (B) runtime required for network construction, and (C) runtime for network simulation excluding network construction as a function of the degree of parallelization at constant network size (strong scaling). Data are for the same network model and machine as in Figure 1. The dashed vertical line in each figure indicates the number of cores available on the compute node. Results obtained with the standard allocator ptmalloc are shown in red (parallelization with OpenMP) and blue (parallelization with MPI) and show the same data as in Figure 1, while results for alternative allocation algorithms are shown in green (tcmalloc), violet (tbb), and yellow (jemalloc) respectively; see Section 2.4 for detailed specification of allocators. Data in (C) are shown in double-logarithmic representation, with the black line indicating ideal scaling.
