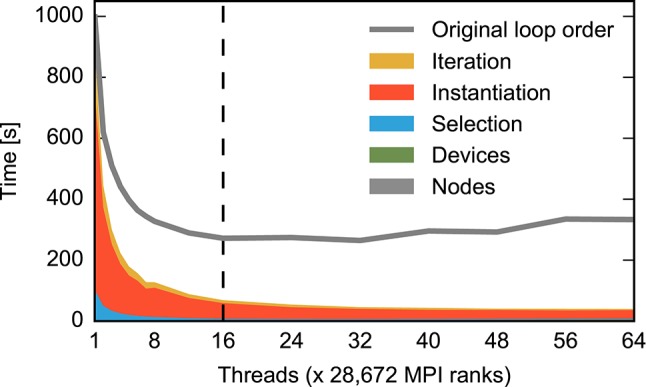
Figure 6.

Time required for the construction of the large neuronal network using the alternative loop order. Color code and data ranges are the same as in Figure 3B showing the construction time prior to the reorganization of loops. The times required to create the network nodes and to connect devices and neurons are too small to be visible in the present graph. Listing 3 illustrates the algorithm. The gray curve shows the total construction time from Figure 3B for comparison. The dashed vertical line indicates the number of physical cores available on a compute node. The double-logarithmic representation of the same data in Figure 7 illustrates the scaling at large numbers of threads. Network construction is performed with instrumented code incurring runtime overhead compared to Figure 7, see Section 2.5.
