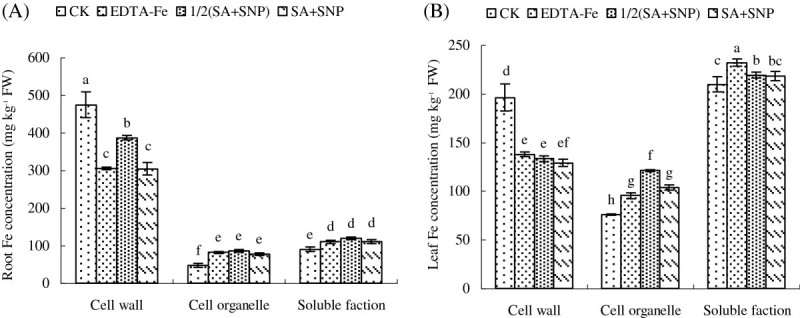
Figure 2.

Effects of different treatments on tissue distribution of Fe in peanut roots (A) or leaves (B). Different lower case letters in the same line indicate a significant difference (P < 0.05) between different treatments. The values are means ± SD of three replicate samples per treatment. CK: hydroponic systems; EDTA-Fe: Hoagland nutrient solution containing 0.1 mM EDTA-Fe; SA: hydroponic systems and foliar application of 1.0 mM SA; SNP: hydroponic systems and foliar application of 2.5 mM SNP; SA+SNP: hydroponic systems and foliar application of 1.0 mM SA and 2.5 mM SNP; 1/2(SA+SNP): hydroponic systems and foliar application of 0.5 mM SA and 1.25 mM SNP.
