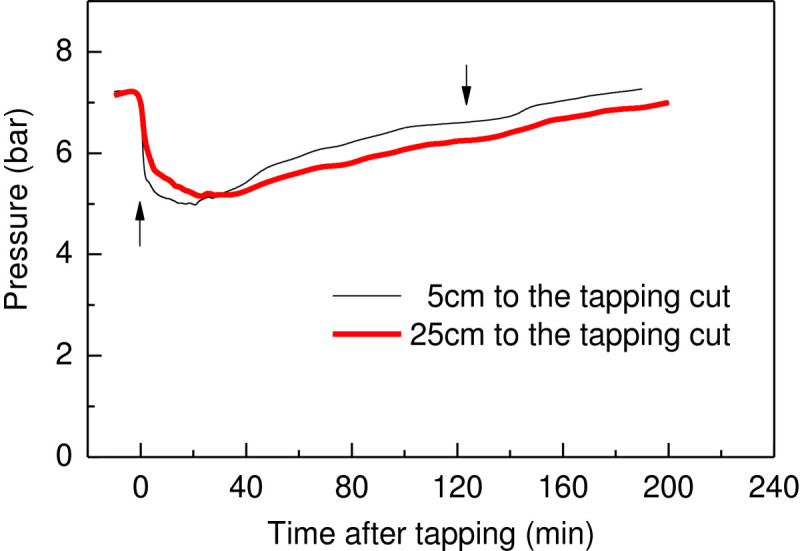
Figure 7.

Phloem turgor pressure variation at 5 cm and 25 cm beneath the tapping cut during latex flow. Measurements were made on three trees, only one typical result was illustrated. The upward arrow indicates the time of tapping and the downward arrow indicates the stoppage of latex flow.
