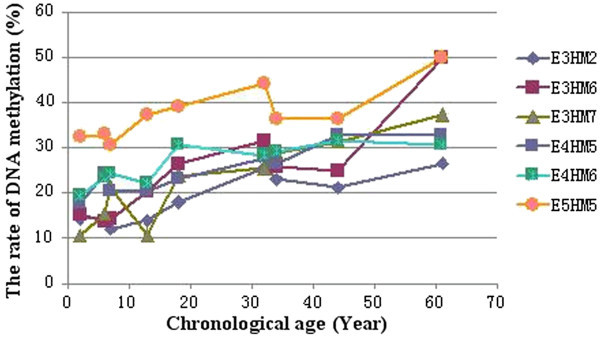
Figure 2.

DNA methylation rate trends for each primer pair across nine chronological ages. The x axis is the chronological age, the y axis is the DNA methylation rate. Data for E3HM2 are shown with ◆; for E3HM6 with ■; for E3HM7 with ▲, and so on.

DNA methylation rate trends for each primer pair across nine chronological ages. The x axis is the chronological age, the y axis is the DNA methylation rate. Data for E3HM2 are shown with ◆; for E3HM6 with ■; for E3HM7 with ▲, and so on.