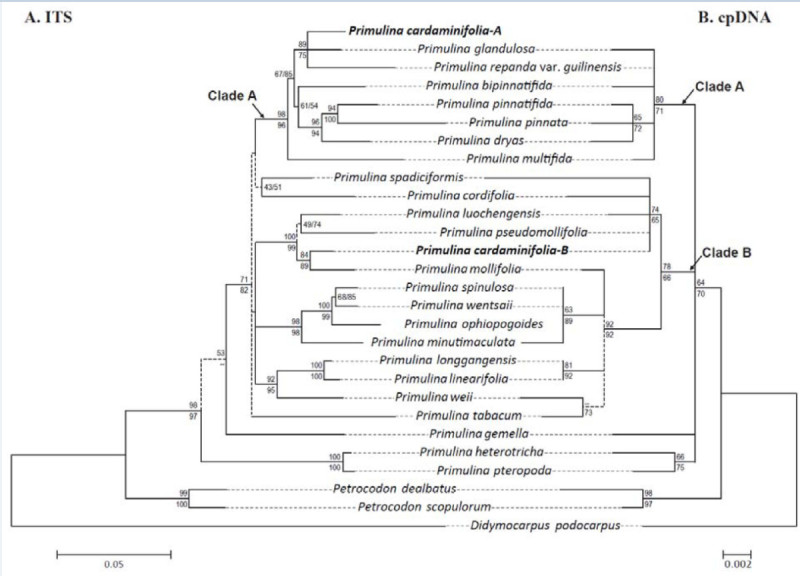
Figure 6.

Maximum likelihood phylogenies of A. ITS (left) and B. trnL-F intron spacer region (right) with clade supports (LB: upper; PB: lower). Low support clades (LB and PB < 50%) are denoted by dash lines.

Maximum likelihood phylogenies of A. ITS (left) and B. trnL-F intron spacer region (right) with clade supports (LB: upper; PB: lower). Low support clades (LB and PB < 50%) are denoted by dash lines.