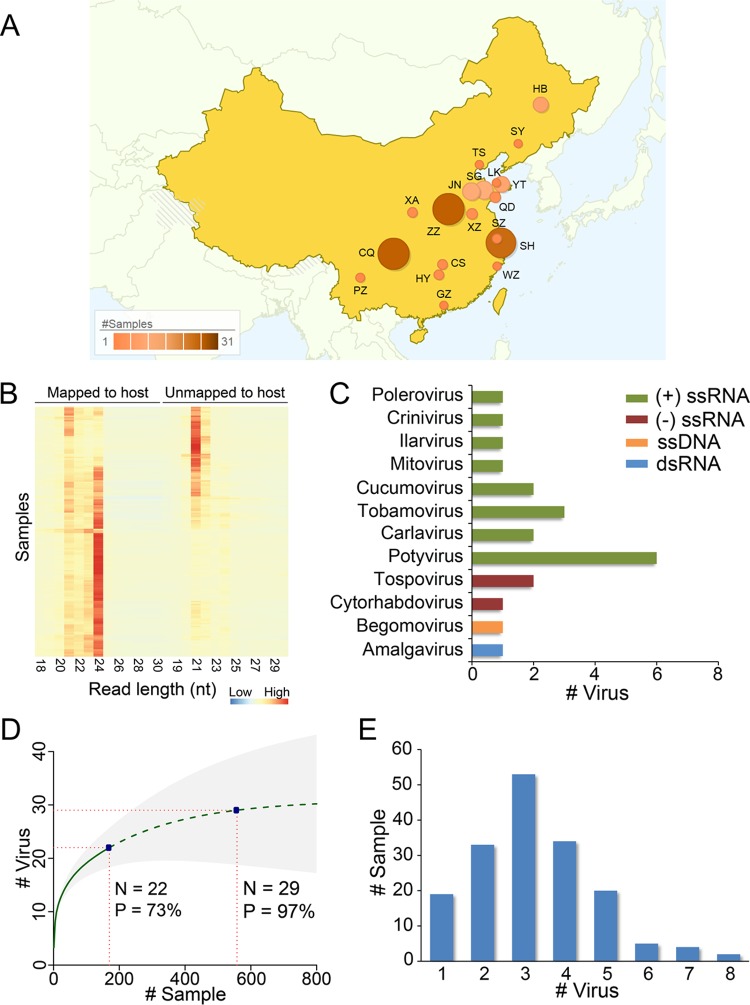
FIG 1.
Virus detection in field-grown tomato samples in China using sRNA sequencing. (A) Distribution of the sampling regions in China. Color and size of the circles indicate the sampling size. Regions are shown by acronyms, and their full names are listed in Table S1 in the supplemental material. (B) Read size distribution in collected samples. (C) Classification of viruses detected in the tomato samples. (D) Viral discovery curve to assess the saturation and estimate the richness (number of viral species). The solid green line is the rarefaction curve, the dashed green line indicates the Chao2 estimation of asymptotic richness by sample number, and shading shows 95% confidence intervals. Current sampling size and estimated size for 97% sampling completeness are marked. (E) Summary of samples by the number of detected viruses per sample.

