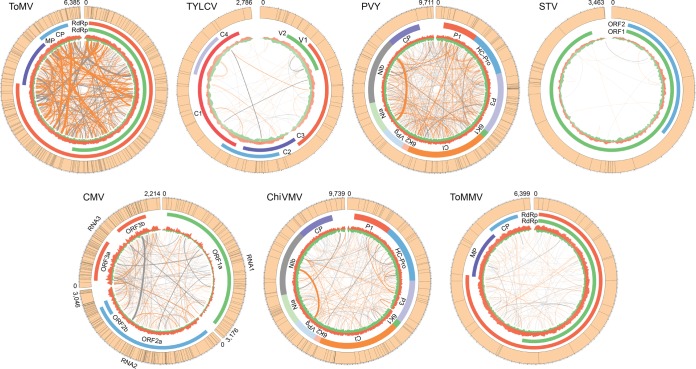
FIG 4.
Population diversity of tomato viruses in China. Genomes of the seven most prevalent tomato viruses are shown. SNP positions in the genome of each virus are indicated as black lines in the outer circle of each plot. Colored segments close to the outer circle are coding regions. Depth for vsiRNA reads mapped on the positive strand (red) or negative strand (green) is shown in the inner circle. Orange and gray lines link the recombination sites from positive-positive and positive-negative strands, respectively. Recombination frequencies in the samples are indicated by the line width.

