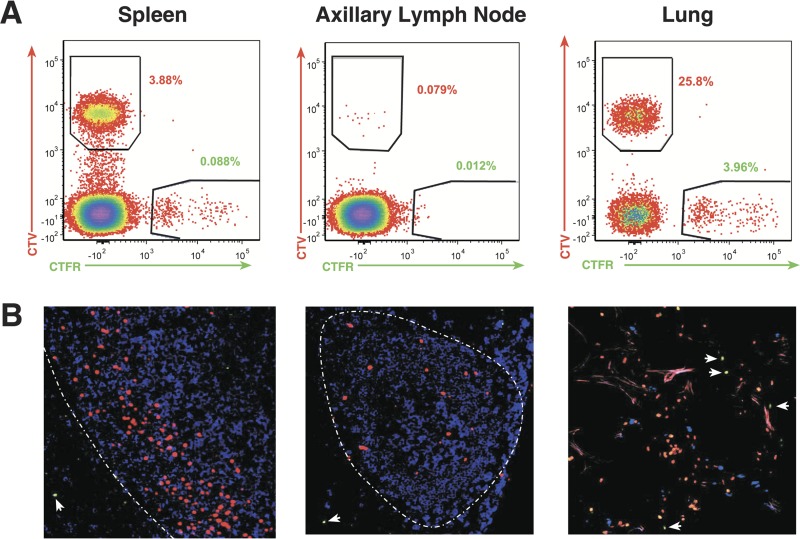
FIG 5.
Detection of infused cells in lymphoid tissues. (A) Representative flow cytometry analysis for CTV and CTFR staining of T cells isolated from of 48-h tissue samples from animal 4 with samples identified above each plot. (B) Thin-section confocal merged micrographs of tissue samples from animal 4 with CTV+ cells pseudocolored red (CD8CXCR5 T cells), CTFR+ cells pseudocolored green (CD8 T cells), and anti-CD20+ cells pseudocolored blue (B cells). The T-cell zone/B-cell follicle interface is indicated by a white broken line. Untransduced CTFR+ cells are indicated with white arrows.

