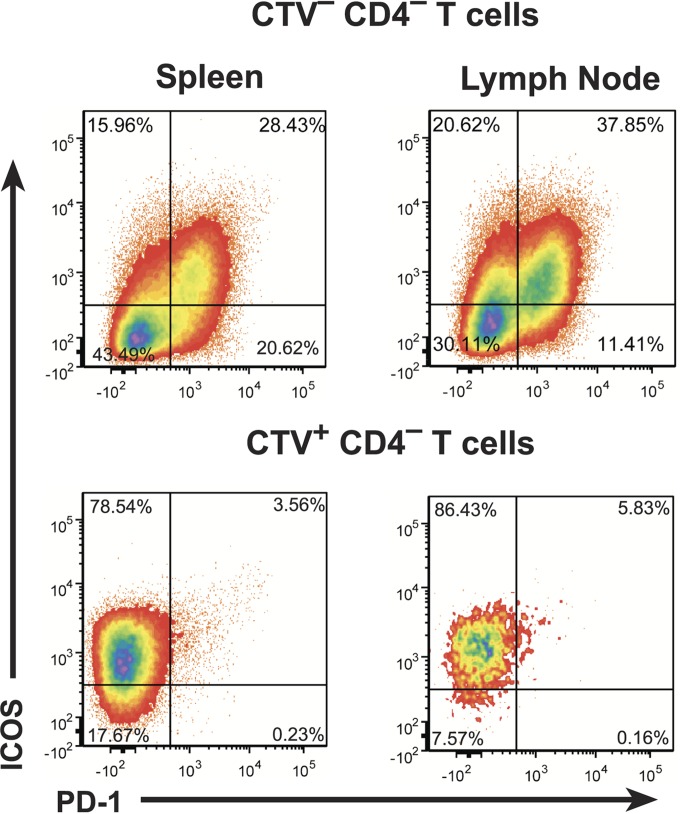
FIG 8.
Maintenance of ICOS expression in CD8hCXCR5 T cells. Representative flow cytometry analysis plots for ICOS and PD-1 expression in CD3+ T cells isolated from spleen and lymph node samples from animal 4 are presented. Gating for endogenous CTV− CD4− (top) and CTV+ CD8hCXCR5 T cells (bottom) cells are denoted above each plot.

