
FIG 9.
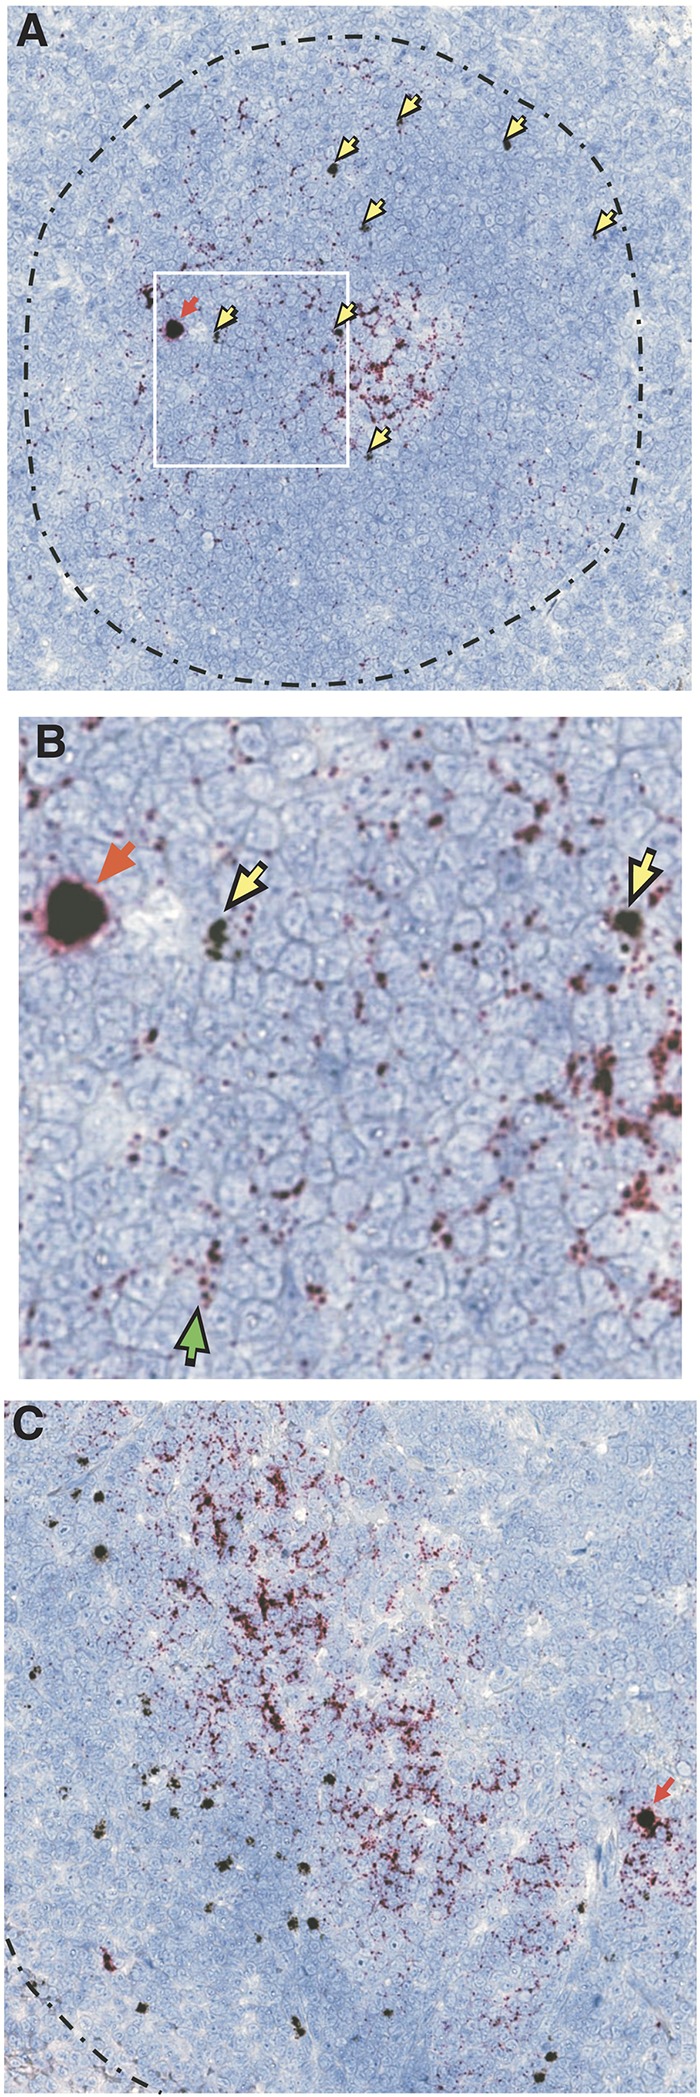
Duplex ISH detection of CD8hCXCR5 T-cell and SIV-infected cells in B-cell follicles. Representative duplex ISH analysis of thin tissue sections with retroviral vector RNA probe-hybridizing cells in black (examples highlighted with yellow arrows) and SIV hybridization in red (examples of red-staining cells highlighted with red arrows), with the T-cell zone/B-cell follicle border indicated by a broken black line. (A) Lymph node sample with an example of close proximity between infected and CD8hCXCR5 T cells boxed in white. (B) Magnification of the boxed lymph node area with a green arrow indicating an example of the presence of individual virions. (C) Spleen sample.