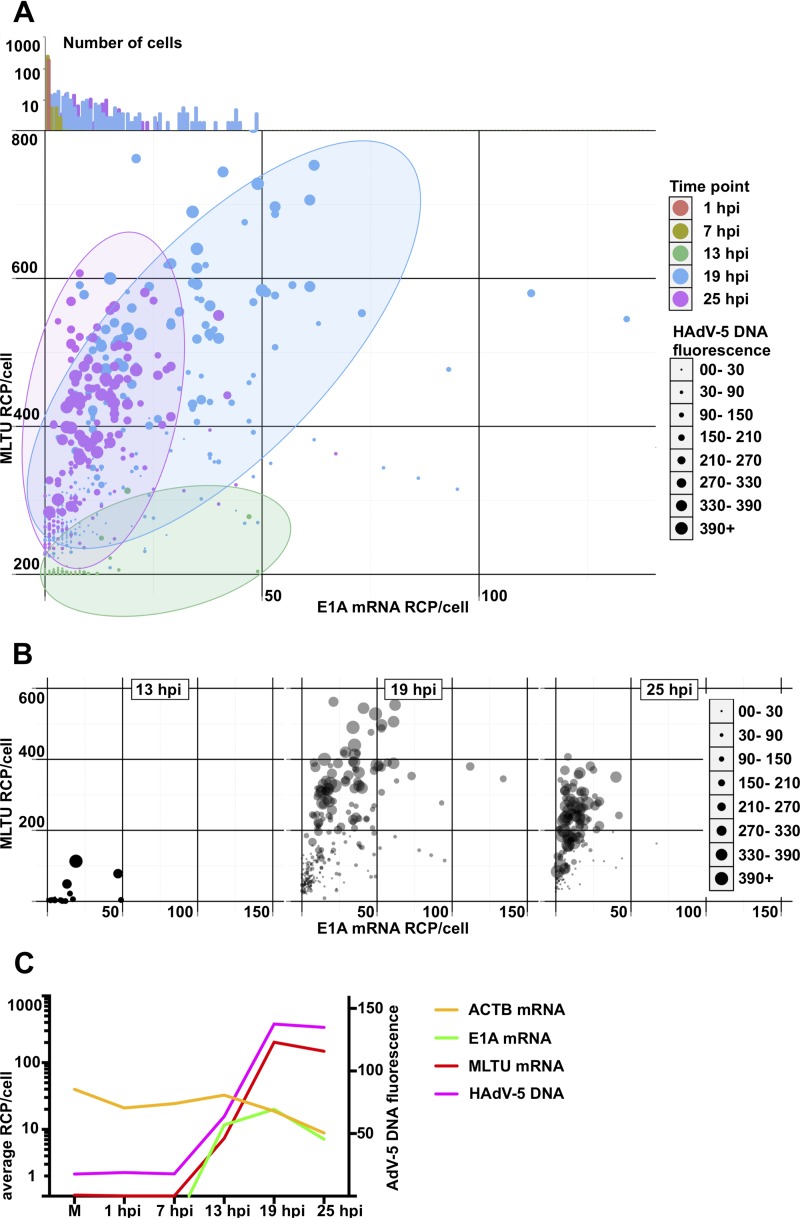
FIG 4.
Single-cell quantification of HAdV-5 DNA and viral mRNAs in HeLa cells at different time points postinfection. (A) All cells, color-coded depending on the infection time point, were distributed in the scatterplot depending on E1A (x axis) and MLTU mRNA expression (y axis). The diameter of the data point is proportional to HAdV-5 DNA content based on its fluorescence signal. Cells from 1 and 7 hpi were grouped at the plot origin, as no specific E1A/MLTU/virus DNA detection was observed in these cells. Since some data points are overlapping in the two-dimensional scatterplot, E1A mRNA expression histograms for all time points were plotted against the log10 cell number above the scatterplot. Dominant 1- and 7-hpi cell populations close the plot origin are clearly visible (orange- and olive-colored columns). (B) Individual scatterplots of 13, 19, and 25 hpi from experiments shown in panel A. The data points for 19 and 25 hpi are plotted with 40% transparency. (C) Geometric averages of HAdV-5 DNA and viral mRNAs in infected HeLa cells. Average RCP/cell (y axis) was calculated for MLTU mRNA (red), E1A mRNA (green), and ACTB (yellow) and plotted against time (x axis). HAdV-5 DNA arbitrary fluorescence is presented on the secondary vertical y axis.

