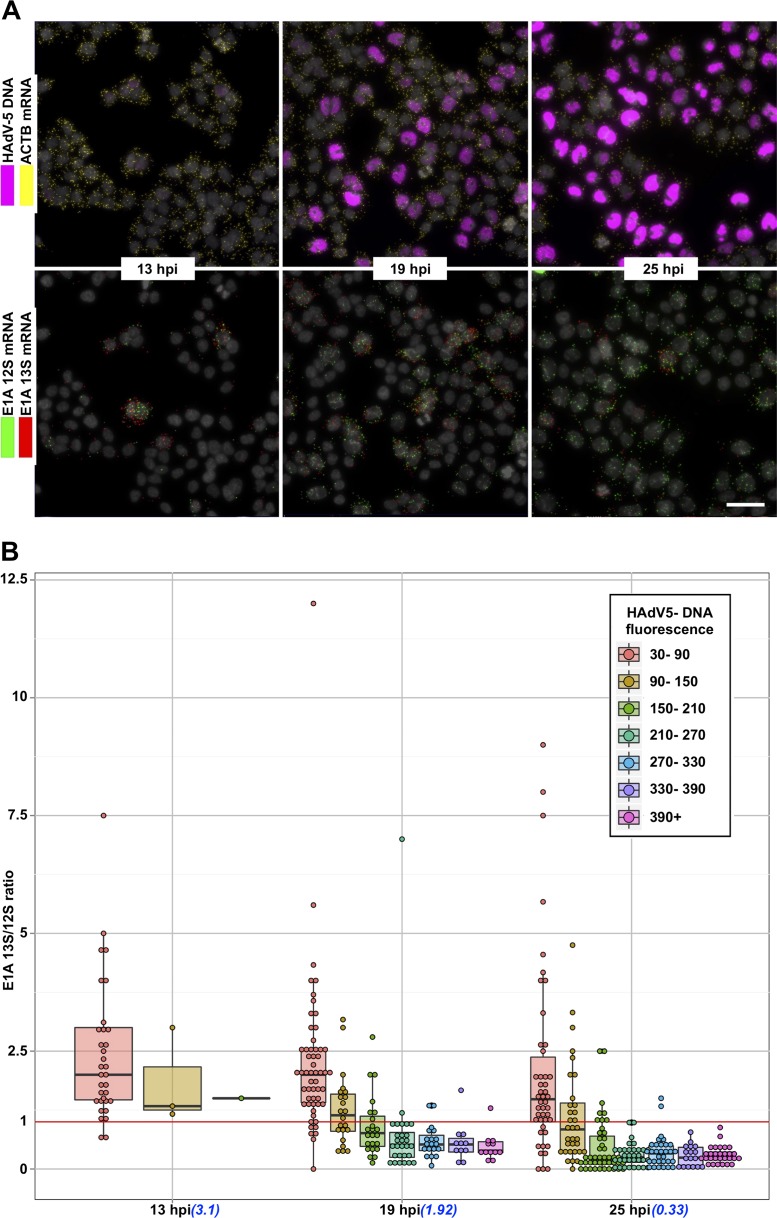
FIG 5.
Single-cell E1A 13S/12S splice variant expression ratio in HeLa cells at 13 hpi, 19 hpi, and 25 hpi. (A) E1A 13S mRNA (red) and 12S mRNA (green) detection in individual HAdV-5-infected (magenta) HeLa cells. Scale bar, 50 μm. (B) Cells at each time point were divided into groups and color coded based on their HAdV-5 DNA fluorescence. Each data point (which represents an individual cell) was distributed in the plot depending on the time point (x axis) and E1A 13S/12S splice variant expression (y axis). Finally, a box-and-whisker plot for each cell group was overlaid with data points. The lower and upper hinges of box plots correspond to the first and third quartiles (the 25th and 75th percentiles). Black line, median; upper whisker, highest value that is within 1.5× the interquartile range of the hinge; lower whisker, lowest value within 1.5× the interquartile range of the hinge; red line, E1A 13S/12S ratio of 1, showing equal expression of both splice variants. Calculated geometrical average E1A 13S/12S mRNA ratios at indicated time points are shown in parentheses below the x axes.

